
- Solve real problems with our hands-on interface
- Progress from basic puts and calls to advanced strategies
Interactive Options Course
Posted November 14, 2025 at 5:09 am
1/ AMD Technical Analysis: A Bullish Surge Continues
2/ NVDA: Trading the Profit-Taking Pause Before the $210 Target
3/ Tesla Eyes $480: The Setup After the $443 Consolidation
4/ META’s Oversold Dip: Why the Mag 7 Behemoth is Targeting the $678 200DMA
5/ Palantir Targeting $207 as the Superstar Consolidates at $187
Investopedia is partnering with CMT Association on this newsletter. The contents of this newsletter are for informational and educational purposes only, however, and do not constitute investing advice. The guest authors, which may sell research to investors, and may trade or hold positions in securities mentioned herein do not represent the views of CMT Association or Investopedia. Please consult a financial advisor for investment recommendations and services.
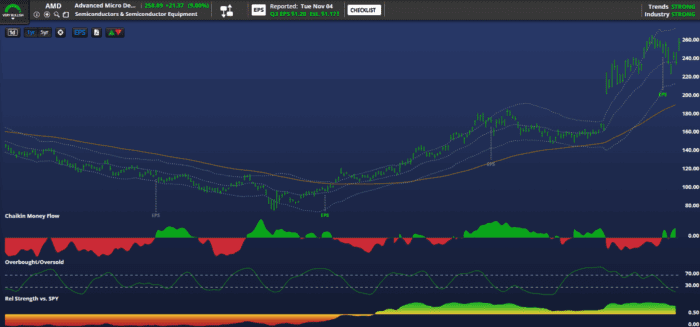
AMD Technical Analysis: A Bullish Surge Continues

In today’s session, we analyze the five most volume-weighted stocks traded on Wednesday, beginning with Advanced Micro Devices (AMD), which soared 9%. After hitting its 52-week low of $76 in early April, AMD began a steady recovery. The rally intensified in mid-June when the stock first closed above its 200-day moving average (DMA), even while the DMA was still slightly declining. By early August, the 200-day average began to trend upward itself, signaling a powerful structural shift in the stock’s long-term momentum.
A significant acceleration occurred on October 6th when the stock gapped up 24%, propelling the Relative Strength Index (RSI) to a peak euphoria reading of 86 two days later. This intense bullish pressure drove the stock to new all-time highs of $267 on October 29th. The stock has maintained a strong momentum signal, trading consistently above the 50 RSI level since September 29th, confirming that bulls remain firmly in control of the near-term trend.
Given the technical setup, the short-term target for AMD is a new all-time high of $270, representing an approximate 4% gain achievable within the next two to three weeks. Entries around the $240 level may be particularly rewarding, offering a favorable risk/reward profile as the stock consolidates recent gains before its anticipated move toward the $270 zone.
NVDA: Trading the Profit-Taking Pause Before the $210 Target
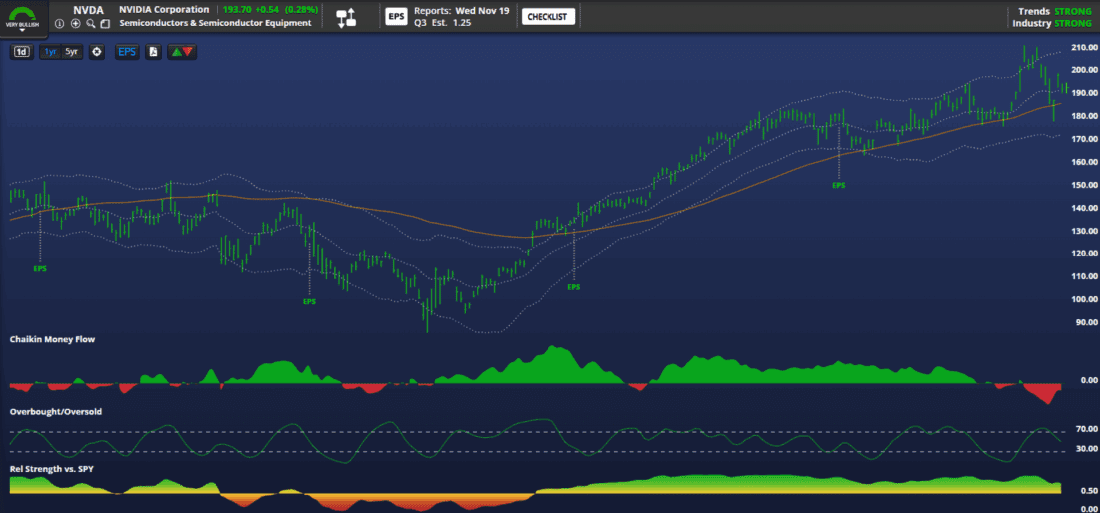
NVIDIA (NVDA), a company arguably changing the entire world with its AI dominance, reached its 52-week low of $87.00 in early April, then began an unrelenting surge toward its all-time high of $212 on October 29th. The foundation for this run was secured in mid-May when NVDA closed above its then-steady 200-day moving average at the $125 level, a pivotal crossover that coincided with the stock entering its first prolonged overbought period of the year.
NVDA’s aggressive ascent was confirmed by repeated bullish momentum, registering overbought readings from late June through the end of July, and again on the day of the all-time high. Following the October 29th peak, the current price action suggests that the market has initiated a period of profit-taking. This action is expected to place the stock in a consolidation “penalty box” for approximately ten more days, though the robust technical structure suggests a strong floor of support exists at the $175 level.
Given this expected consolidation, entries under $192.00 should prove profitable for traders positioning for the next leg up. The strategic target is set at $210.00 by mid-December, which represents a highly desirable 8% gain from Wednesday’s close. This targeted rebound brings the stock back within striking distance of its all-time highs, confirming that the long-term bullish trend remains intact.
Tesla Eyes $480: The Setup After the $443 Consolidation

Tesla (TSLA) has maintained a rising 200-day moving average (DMA) throughout the entire year, underscoring persistent long-term strength and resilience. Although the stock peaked on December 18th, 2024, at roughly $489, it experienced a corrective phase that saw it close beneath its 200DMA from early March through early May. After reaching a 52-week low of $214 in early April, the stock swiftly recovered, quickly reasserting the supportive nature of the rising 200-day trendline.
Euphoric moments, interpreted through an overbought Relative Strength Index (RSI), were observed last December leading into the all-time high, briefly in mid-May, and more significantly from mid-September through early October. Notably, the stock was briefly oversold from late February through mid-March, a condition typically unexpected for a strong performer, yet it hung in with the rising 200DMA and recovered. The stock continued to trade close to this key support until a decisive breakout above $365 occurred in mid-September, coinciding with the return of a prolonged overbought period.
The current price action suggests the stock is now consolidating and setting up for the next surge toward its all-time high zone. Entries under the $443 level offer a favorable risk/reward proposition for positioning in this movement. Based on this technical setup, the short-term target is $480 by early December, which would place the stock very close to challenging its previous all-time high level.
META’s Oversold Dip: Why the Mag 7 Behemoth is Targeting the $678 200DMA
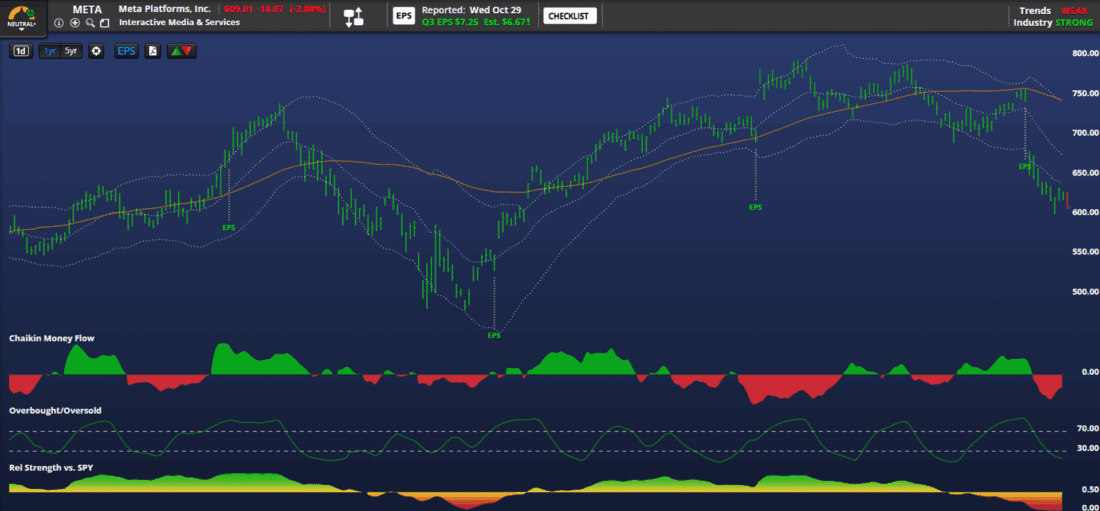
Meta Platforms (META) recently encountered significant resistance after earnings, stemming from investor concerns over its aggressive AI spending initiatives. The stock was all the rage from late January into mid-February, capping its initial surge on Valentine’s Day with an impressive 84 Relative Strength Index (RSI) reading. The stock then had a difficult period throughout the month of April, trading beneath its still-rising 200-day moving average (DMA), before ultimately recovering to an all-time high of $796 on August 15th.
The drama unfolded on October 30th during the earnings report, where the stock gapped down and closed 11% lower, immediately entering an oversold condition where it has remained. The 200-day moving average (DMA), currently at $678, is now starting to decline ever so slightly, signaling potential long-term trend weakness if not recovered quickly. Despite this technical setback, we maintain conviction in the Mag 7 complex and the long-term thesis for AI capital expenditures. Meta is an absolute behemoth, with one-third of the globe using its services daily.
While the stock has gone lower than anticipated, I believe it bottoms and bases around the $610 level before enjoying a bullish three-week run aligned with the broader global bull rally. We believe this stock has the technical resilience to regain its 200DMA of $678 by December, representing an 11% gain from current levels. A move back above $678 will then require much further work and sustained momentum to challenge the all-time high of $796.
Palantir Targeting $207 as the Superstar Consolidates at $187
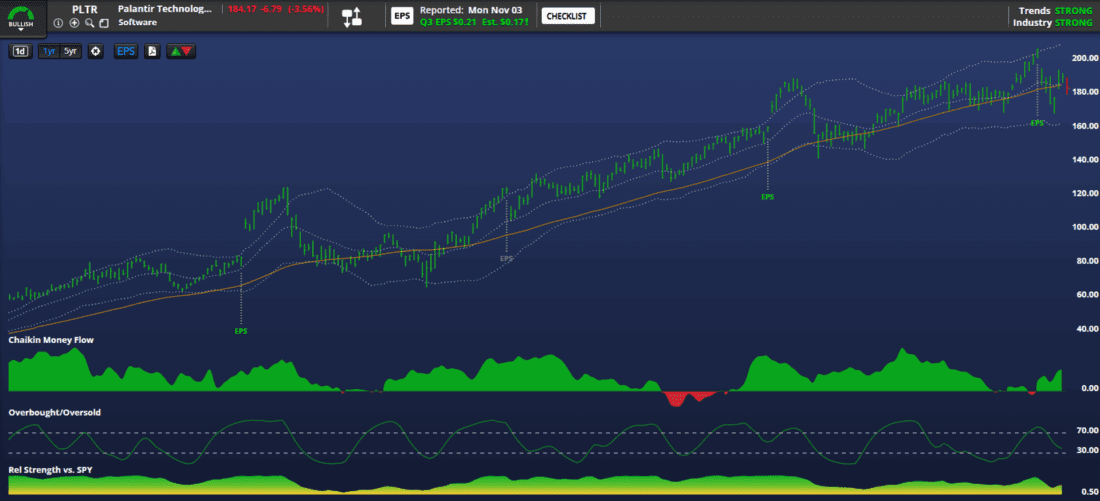
Palantir Technologies (PLTR) has been an absolute superstar this year, ranking among the greatest gainers in the S&P 500. The stock’s 52-week low came last November at $59 a share, surging unrelentingly to its all-time high just nine days ago at nearly $208 a share. This immense strength is technically confirmed by its momentum: PLTR has traded consistently above a 41 RSI since early April, a period that included significant global tariff market volatility.
PLTR’s high-momentum periods included being overbought for half of February and a week in August. Importantly, the stock was notably never oversold all year and did not close beneath its rising 200-day moving average even once during the April global scare, confirming its absolute technical superiority. A slight bearish divergence occurred on the all-time high day of November 3rd, as the RSI barely scratched 71, giving way to the consolidation we see now, which included a -3.6% day on Wednesday.
The current price action suggests the stock will still move sideways for about another week or so, creating a compelling opportunity for entry. I believe entries under the $187 level will be profitable for the next leg up. My mid-December target is $207, representing a strong 13% gain and nearly matching its prior all-time high.
—
Originally posted 13th November 2025
Investopedia.com: The comments, opinions and analyses expressed herein are for informational purposes only and should not be considered individual investment advice or recommendations to invest in any security or to adopt any investment strategy. While we believe the information provided herein is reliable, we do not warrant its accuracy or completeness. The views and strategies described on our content may not be suitable for all investors. Because market and economic conditions are subject to rapid change, all comments, opinions and analyses contained within our content are rendered as of the date of the posting and may change without notice. The material is not intended as a complete analysis of every material fact regarding any country, region, market, industry, investment or strategy. This information is intended for US residents only.
Information posted on IBKR Campus that is provided by third-parties does NOT constitute a recommendation that you should contract for the services of that third party. Third-party participants who contribute to IBKR Campus are independent of Interactive Brokers and Interactive Brokers does not make any representations or warranties concerning the services offered, their past or future performance, or the accuracy of the information provided by the third party. Past performance is no guarantee of future results.
This material is from Investopedia and is being posted with its permission. The views expressed in this material are solely those of the author and/or Investopedia and Interactive Brokers is not endorsing or recommending any investment or trading discussed in the material. This material is not and should not be construed as an offer to buy or sell any security. It should not be construed as research or investment advice or a recommendation to buy, sell or hold any security or commodity. This material does not and is not intended to take into account the particular financial conditions, investment objectives or requirements of individual customers. Before acting on this material, you should consider whether it is suitable for your particular circumstances and, as necessary, seek professional advice.
Related Articles


Join The Conversation
For specific platform feedback and suggestions, please submit it directly to our team using these instructions.
If you have an account-specific question or concern, please reach out to Client Services.
We encourage you to look through our FAQs before posting. Your question may already be covered!