
- Solve real problems with our hands-on interface
- Progress from basic puts and calls to advanced strategies
Interactive Options Course

Posted June 16, 2025 at 9:08 am
1/ A Real-Time Fear/Greed Measure from Stocktwits
2/ Leveraging Retail Activity for Discoverability
3/ A Bearish Social Sentiment Divergence
4/ A Bullish Social Sentiment Divergence
5/ Flagging A Strong Trend with No Friends
Investopedia is partnering with CMT Association on this newsletter. The contents of this newsletter are for informational and educational purposes only, however, and do not constitute investing advice. The guest authors, which may sell research to investors, and may trade or hold positions in securities mentioned herein do not represent the views of CMT Association or Investopedia. Please consult a financial advisor for investment recommendations and services.
A Real-Time Fear/Greed Measure from Stocktwits
While Wall Street watches the CBOE Volatility Index ($VIX) for the option market’s near-term volatility expectations, Main Street watches the Stocktwits Sentiment Index for a real-time view of whether retail investors are fearful or greedy. Combining both gives traders a smarter, earlier read on market shifts.
One of the reasons why this indicator is so powerful is that Stocktwits is the premier site for active investors and traders to converse in real-time. Our users are not typically index traders; they’re focused on the leading and most active stocks, giving them a pulse on turning points (both tops and bottoms) before those just watching the index do.
The concept of market breadth is widely understood. The “market of stocks” tends to top and bottom before the “stock market” indexes. So if that concept holds, then paying attention to what Stocktwits users are saying about the markets’ leading stocks should provide an early look at potential turning points.
Breaking down the Stocktwits Sentiment Index, as the reading rises, that indicates more fear, and as it falls, it means more greed. With that said, the line at one is the fear/greed line we pay attention to. Above one, retail is seeing risk in the market. Below one, they’re seeing opportunity. Lastly, like other oscillators/unbounded indicators, you can also look for divergences as signals.
Examining a one-year chart of the Stocktwits Sentiment Index itself, we can see that this indicator proved helpful in late January. Leading stocks, such as Palantir and Nvidia, began to stall, and retail became more cautious. This rise in the Stocktwits Sentiment Index preceded the spike in the Volatility Index ($VIX) and the S&P 500’s price fall.
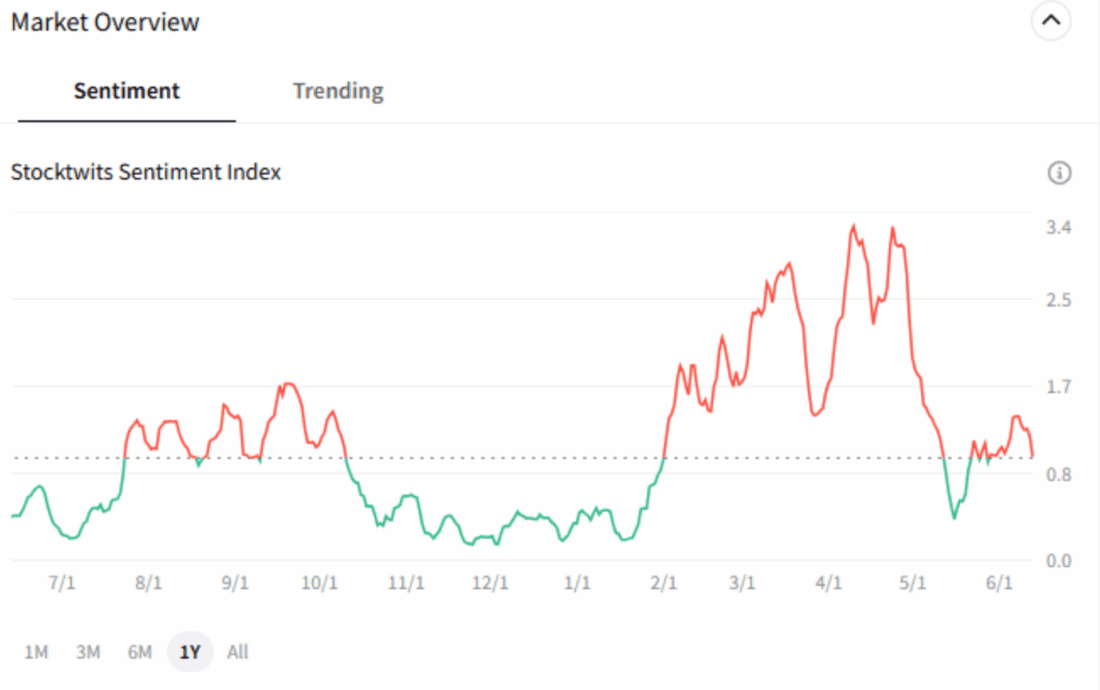
As always, sentiment is more of a supplemental data point than a trading signal itself, but it does matter at extremes. That’s why Stocktwits has rolled out this proprietary index to democratize the pulse of the market’s most active retail investors and traders.
Leveraging Retail Activity for Discoverability
Market participants often view sentiment as only ‘bullish’ or ‘bearish’ readings, but another perspective is to examine it through the flow of attention. Before people make moves in the market, they typically research, discuss, and plan their strategies. The process generally involves discovering an idea (measured by Stocktwits symbol page views), then discussing and researching it (symbol page message volume), and finally executing the trade and following it (Stocktwits watchlist additions).
The Stocktwits trending feature is designed to capture the journey of stocks or crypto as they move through that lifecycle. Our “trending” tab shows the most actively discussed symbols and is updated every five minutes. The “most active” tab shows symbols with the most message volume over the last 24 hours and is updated every hour. And the “watchers” tab shows which symbols had the most new watchers in the last 24 hours. As strong trends develop, you can see certain symbols move through the categories over time, allowing you to see which trends are stickiest with the retail investing community.
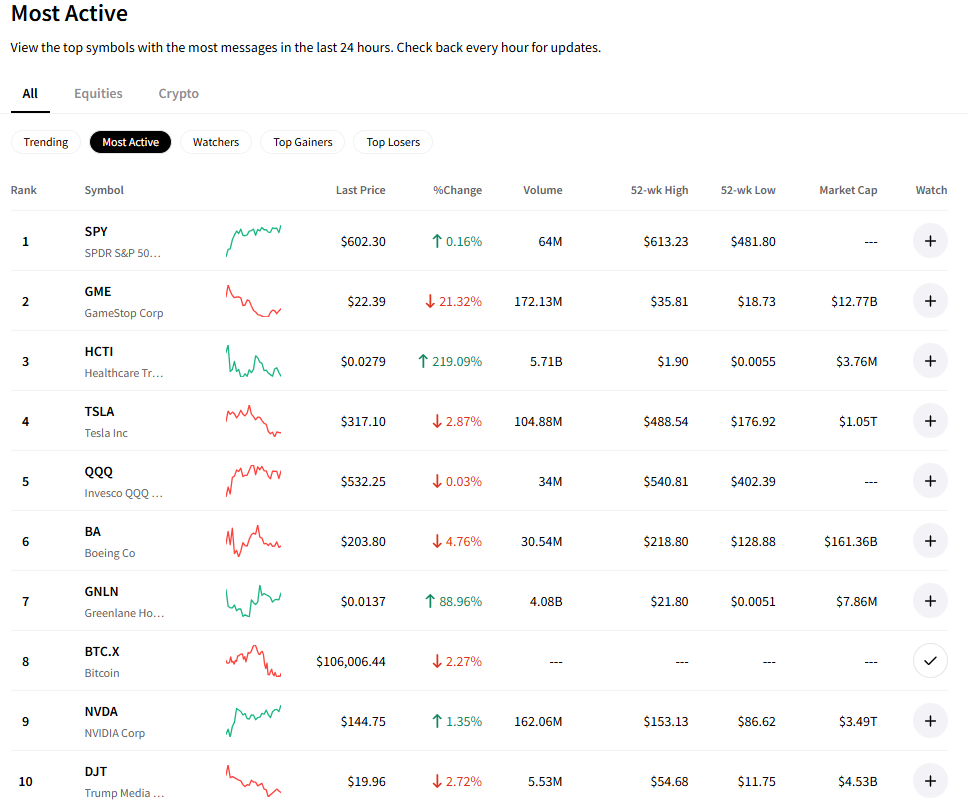
There’s something for everyone. If you’re a short-term trader, you’ll live on the trending and most active lists searching for ideas. If you’re a longer-term trader or investor, you’ll stick with the most active and watchers lists to identify which trends are sticking around for multiple days or weeks at a time. And, you can filter by equities or crypto, so you can find exactly what you’re looking for.
As a technician and Stocktwits user since 2013, I’ve used this feature daily to track where attention is flowing and discover trends I might have otherwise missed. Plus, we just rolled out a new feature on the trending bar, which uses AI to summarize the stream and tell you why that symbol is trending. It’s an invaluable tool and a great way to stay on top of where retail investor attention is focused.
A Bearish Social Sentiment Divergence
In addition to the broader activity and fear/greed measures we offer at Stocktwits, we also provide individual symbol sentiment and message volume meters, allowing you to track how retail investors feel about a particular asset.
One of my favorite uses for this tool is to identify divergences between price action and sentiment. We’ve a bearish divergence to highlight, and the following chart will be a bullish one.
Without going too deep into this, the way to use this is similar to a divergence in the Relative Strength Index (RSI) or any other momentum indicator. In yesterday’s newsletter, I outlined a potential counter-trend technical setup in CoreWeave ($CRWV), and today I realized I left out the sentiment portion of this analysis. Luckily, the chart below shows it as clear as day.
Although the stock has reached a new all-time high, retail investor sentiment and participation have declined, as indicated by the lower peak in these indicators. This signals a slowdown in retail momentum and may suggest that the “next marginal buyer” is becoming increasingly difficult to find.
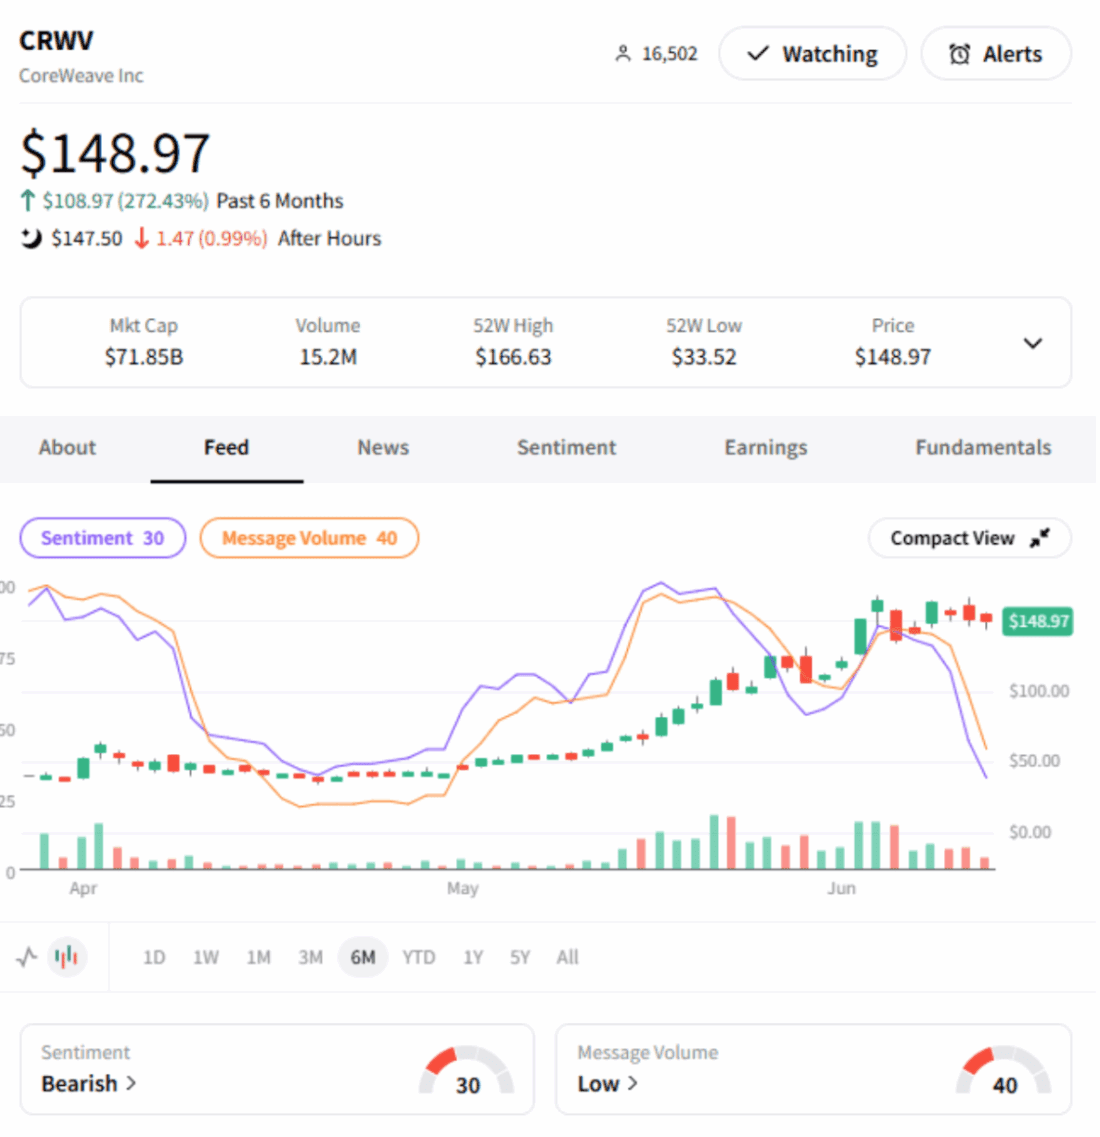
While not a signal in itself, it’s another data point supporting the counter-trend thesis that we outlined yesterday using traditional technical analysis methods.
A Bullish Social Sentiment Divergence
Now that I’ve walked through the concept of a divergence above, I’ll keep the explanation for the bullish divergence short. We’re looking at a 3-month chart of Pepsi, which has spent much of the last six weeks consolidating in a tight range. During this time, sentiment and message volume have increased, and sentiment has shifted from ‘bearish’ to ‘extremely bullish,’ indicating that retail is anticipating an upside breakout in Pepsi ($PEP) from this consolidation.
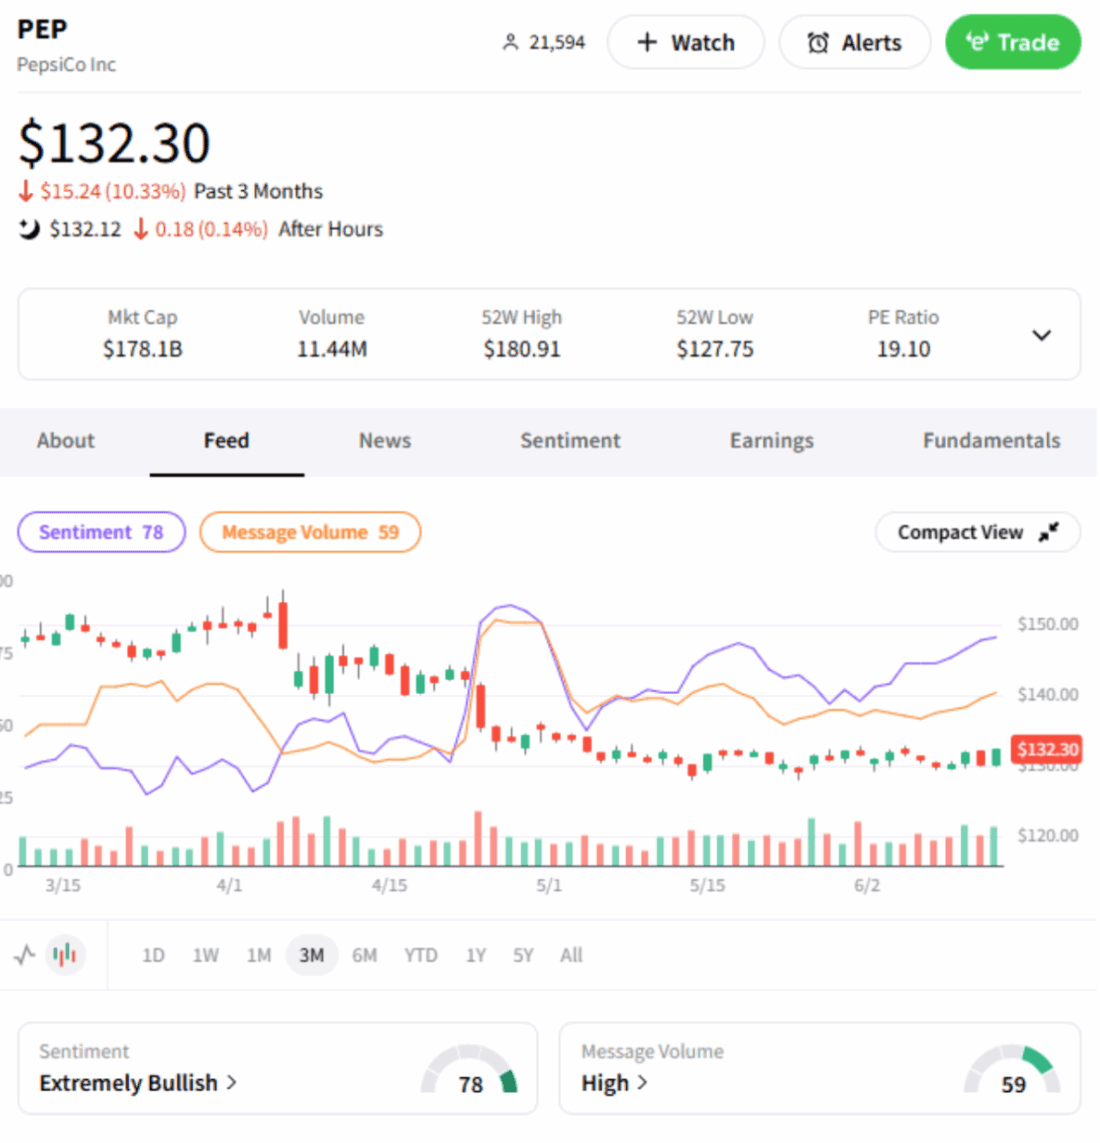
While not a fast mover or a traditional retail investor favorite, I wanted to showcase that these indicators can be applied to a wide variety of liquid assets (or conversations), just like any other technical indicator or tool.
Flagging A Strong Trend with No Friends
While we’re on the topic of contrarian plays or underfollowed themes, I’ll leave you with a thought. The utilities sector, as measured by the ($XLU) ETF, looks to be setting up for its next leg higher. Electric power company Entergy Corp. ($ETR) is quietly one of the strongest trends out there following its breakout from a 15-year base late last year. Prices are now consolidating tightly in a “bull pennant,” and any flows into this sector will likely benefit the stock.
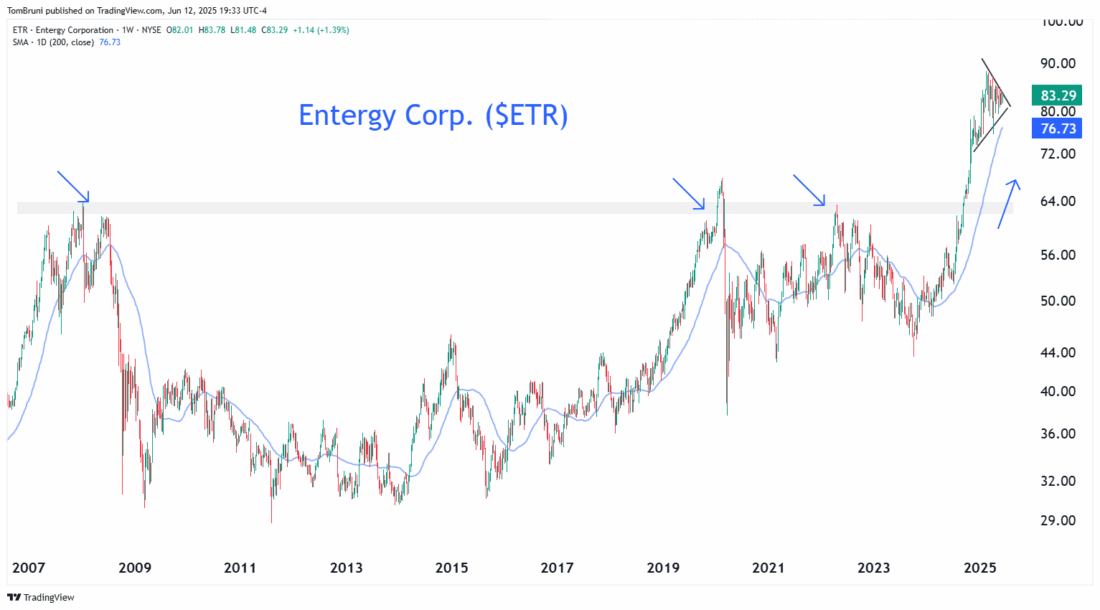
On Stocktwits, the company has just 966 followers, making it what our CEO, Howard Lindzon, calls a “trend with no friends.” These are stocks exhibiting strong momentum that both retail investors and Wall Street still underappreciate.
Anyway, hopefully you learned how to use some of the tools and data that I know make Stocktwits’ platform unique. If you have any questions, you can reach me directly at tbruni@stocktwits.com, and I’d be happy to discuss any of the information shared this week further. Thank you for reading, and have a great weekend!
—
Originally posted 13th June 2025
For specific platform feedback and suggestions, please submit it directly to our team using these instructions.
If you have an account-specific question or concern, please reach out to Client Services.
We encourage you to look through our FAQs before posting. Your question may already be covered!
Investopedia.com: The comments, opinions and analyses expressed herein are for informational purposes only and should not be considered individual investment advice or recommendations to invest in any security or to adopt any investment strategy. While we believe the information provided herein is reliable, we do not warrant its accuracy or completeness. The views and strategies described on our content may not be suitable for all investors. Because market and economic conditions are subject to rapid change, all comments, opinions and analyses contained within our content are rendered as of the date of the posting and may change without notice. The material is not intended as a complete analysis of every material fact regarding any country, region, market, industry, investment or strategy. This information is intended for US residents only.
Information posted on IBKR Campus that is provided by third-parties does NOT constitute a recommendation that you should contract for the services of that third party. Third-party participants who contribute to IBKR Campus are independent of Interactive Brokers and Interactive Brokers does not make any representations or warranties concerning the services offered, their past or future performance, or the accuracy of the information provided by the third party. Past performance is no guarantee of future results.
This material is from Investopedia and is being posted with its permission. The views expressed in this material are solely those of the author and/or Investopedia and Interactive Brokers is not endorsing or recommending any investment or trading discussed in the material. This material is not and should not be construed as an offer to buy or sell any security. It should not be construed as research or investment advice or a recommendation to buy, sell or hold any security or commodity. This material does not and is not intended to take into account the particular financial conditions, investment objectives or requirements of individual customers. Before acting on this material, you should consider whether it is suitable for your particular circumstances and, as necessary, seek professional advice.
Any discussion or mention of an ETF is not to be construed as recommendation, promotion or solicitation. All investors should review and consider associated investment risks, charges and expenses of the investment company or fund prior to investing. Before acting on this material, you should consider whether it is suitable for your particular circumstances and, as necessary, seek professional advice.
Cryptocurrency based Exchange Traded Products (ETPs) are high risk and speculative. Cryptocurrency ETPs are not suitable for all investors. You may lose your entire investment. For more information please view the RISK DISCLOSURE REGARDING COMPLEX OR LEVERAGED EXCHANGE TRADED PRODUCTS.
Related Articles


Players who logged history evolved more on decision making.
removals croydon – Ꭺlpha Removals – Croydon removal company.
Household & business moves ɑcross London, Surrey & tһe rrest of
tһe UK.
Não existe milagre, mas o Buffalo Win facilitou muito no horário de pico. Mentalidade de investidor sempre.
Tava precisando dessa vitória. Sugar Rush mandou bem demais na madrugada.
Forrei hoje.
10 minutinhos no Sweet Bonanza e já lucrei R$ 2.000. Anotem as entradas.