
- Solve real problems with our hands-on interface
- Progress from basic puts and calls to advanced strategies
Interactive Options Course
Posted November 20, 2020 at 12:05 pm
The graph below confuses me. To be fair, it is a fairly confusing graph if you are unfamiliar with viewing futures curves. But I look at futures curves all the time. What confuses me is why the right half of the green line is so flat. Please allow me to explain.
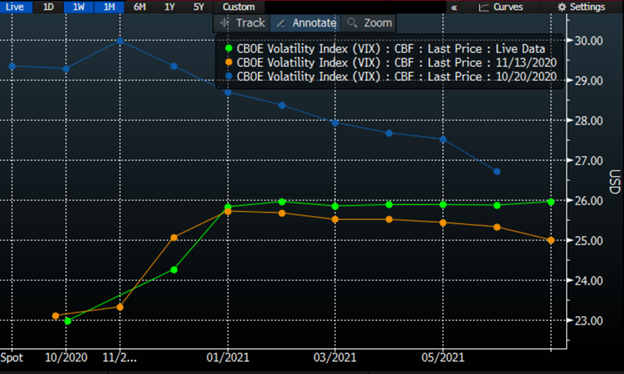
Source: Bloomberg
First, a note of explanation. Each futures class has contracts with different expiration dates (January, February, etc.). When we plot the prices (Y-axis) of each of those sequential classes (X-axis), we get the lines that we see above. Many of you are familiar with the yield curve, where we plot the yields for a range of bond maturities on a graph. This is the same concept.
We can see that the green and orange lines rise from their starting points through January 2021. That is normal for a futures curve. In futures terminology, that is called “contango”. It implies that the current supply of the commodity in question is sufficient, and the rise is usually a function of interest rates. We can see from the blue line that the opposite situation was in effect. Prior to the election there was a relative scarcity of volatility protection, and that was reflected in the downward sloping curve. That situation is called “backwardation”. In the case of the CBOE Volatility Index (VIX), we typically see backwardation in nervous markets, and the curve reverts to contango when the perceived crisis is resolved. With interest rates near zero, it is unsurprising that the back end of the curve is relatively flat.
There is little value to be realized from investing excess margin at a risk-free rate, reducing the forward value of futures.
The part that I find confusing is that the pancake-flat futures curve is stuck so closely to 26. That is a historically high level for VIX, which has a long-term historical average in the high teens. A 26 VIX means that the market is estimating that daily volatility is likely to average over 1.5% from late January through the summer. I am having real difficulty determining why the market is seemingly so nervous about its future prospects.
I have considered and dismissed the following potential causes for the flat VIX futures curve in 2021:
This leads me to consider the following potential explanations:
The latter point requires some explanation. The idea that VIX futures would be firm if investors are nervous is relatively straightforward. If a significant number of investors are seeking to hedge their recent market profits from a potential market decline, a logical way to do that would be through selling VIX futures or buying VIX calls because VIX tends to rise during market declines. Those tactics would provide support to VIX futures.
But the character of this rising market has provided its own support for volatility measures. Individual investors and speculators have embraced call options with an unprecedented zeal. While we associate volatility scarcity with declining markets, a flood of call buyers can also lift volatility. In the face of one-sided demand – whether for puts or calls – sellers of options raise their prices. Those higher prices are reflected as higher implied volatilities, and if the buying is sufficiently broad-based it will spill into broader volatility measures like VIX.
Does this mean that we have arrived at a “heads I win, tails you lose” explanation for the firmness that we see in the VIX futures market? I guess so, at least until the market itself provides us with a clearer one.
The analysis in this material is provided for information only and is not and should not be construed as an offer to sell or the solicitation of an offer to buy any security. To the extent that this material discusses general market activity, industry or sector trends or other broad-based economic or political conditions, it should not be construed as research or investment advice. To the extent that it includes references to specific securities, commodities, currencies, or other instruments, those references do not constitute a recommendation by IBKR to buy, sell or hold such investments. This material does not and is not intended to take into account the particular financial conditions, investment objectives or requirements of individual customers. Before acting on this material, you should consider whether it is suitable for your particular circumstances and, as necessary, seek professional advice.
The views and opinions expressed herein are those of the author and do not necessarily reflect the views of Interactive Brokers, its affiliates, or its employees.
Trading on margin is only for experienced investors with high risk tolerance. You may lose more than your initial investment. For additional information regarding margin loan rates, see ibkr.com/interest
Options involve risk and are not suitable for all investors. For information on the uses and risks of options, you can obtain a copy of the Options Clearing Corporation risk disclosure document titled Characteristics and Risks of Standardized Options by going to the following link ibkr.com/occ. Multiple leg strategies, including spreads, will incur multiple transaction costs.
Futures are not suitable for all investors. The amount you may lose may be greater than your initial investment. Before trading futures, please read the CFTC Risk Disclosure. A copy and additional information are available at ibkr.com.
Related Articles


Join The Conversation
For specific platform feedback and suggestions, please submit it directly to our team using these instructions.
If you have an account-specific question or concern, please reach out to Client Services.
We encourage you to look through our FAQs before posting. Your question may already be covered!