
- Solve real problems with our hands-on interface
- Progress from basic puts and calls to advanced strategies
Interactive Options Course

Posted December 5, 2025 at 9:25 am
Spreads are essential for investors who utilize leverage, but for most fixed income investors, yields are much more important. Fortunately, in today’s market, yields are relatively attractive despite historically tight spreads.
Yields and spreads are two common metrics used to evaluate fixed income securities, but they serve different purposes for different types of investors.
In our view, yields are far more relevant for absolute return investors. The yield on a bond is the return an investor can expect to receive at maturity, assuming the bond does not default. Thus, for traditional, long-only investors (i.e., those that do not use borrowed funds to purchase bonds), yields are what matter. Whether the investor is an endowment that needs to fund its operations or an individual trying to meet a savings goal (college tuition, home ownership, retirement, etc.), the best way to estimate future returns is to look at yields, not spreads.
In contrast, spread is the difference in yield between a fixed income asset and a reference rate (typically a U.S. Treasury bond of the same maturity). Investors demand excess compensation when investing in non-Treasury bonds to offset real and perceived risks, including liquidity, collateral, prepayment, default, and recovery (among others).
For fixed income investors that rely on leverage (i.e., buy bonds with borrowed money), such as hedge funds, spreads are essential. Their funding is always pegged to a reference rate, and their entire business depends on earning more than they are paying to borrow. Said differently, these investors are laser-focused on the difference between their cost of funds and their returns, which is most easily measured in spread. Similarly, Wall Street trading desks price the securities they hold relative to the risk-free rate, given that they also have funding costs, so the entire ecosystem of levered investors and market makers relies on spreads as a proxy for price.1
In theory, spreads are a great market signal, as they tend to widen when risk is elevated and tighten when times are good. But in practice, they can rise and fall for many other reasons, which limits their value as an information source. For example, spreads can move simply because the underlying reference rate changes, which has nothing to do with the credit quality of the issuer. As a result, yields can be attractive whether spreads are wide or tight, and vice-versa.
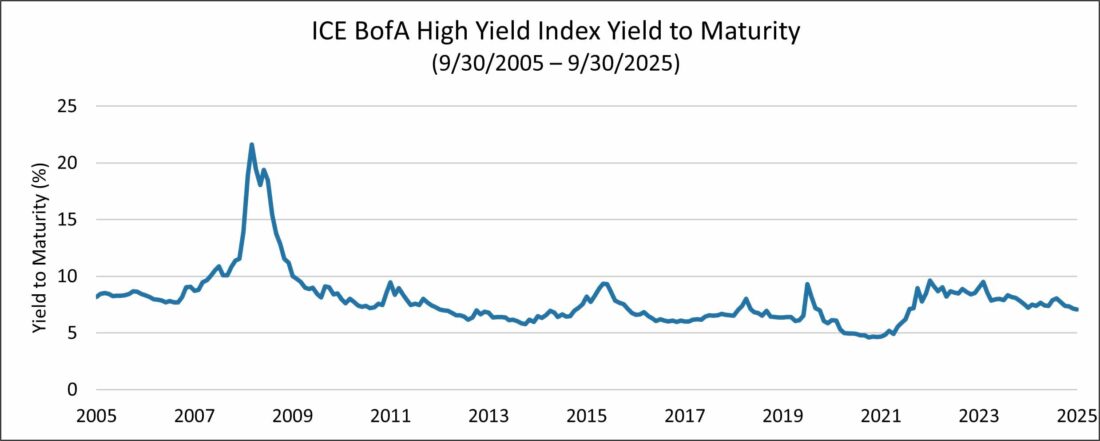
The current environment underscores this point. As we can see below, the spread of the ICE BofA High Yield Index is extremely tight right now – near the low point of the last 20 years.

Source: Bloomberg
Yields, however, tell a different story. Despite historically tight spreads, they are fairly attractive right now, and they are about 250 basis points above the lows in 2021.
Source: Bloomberg
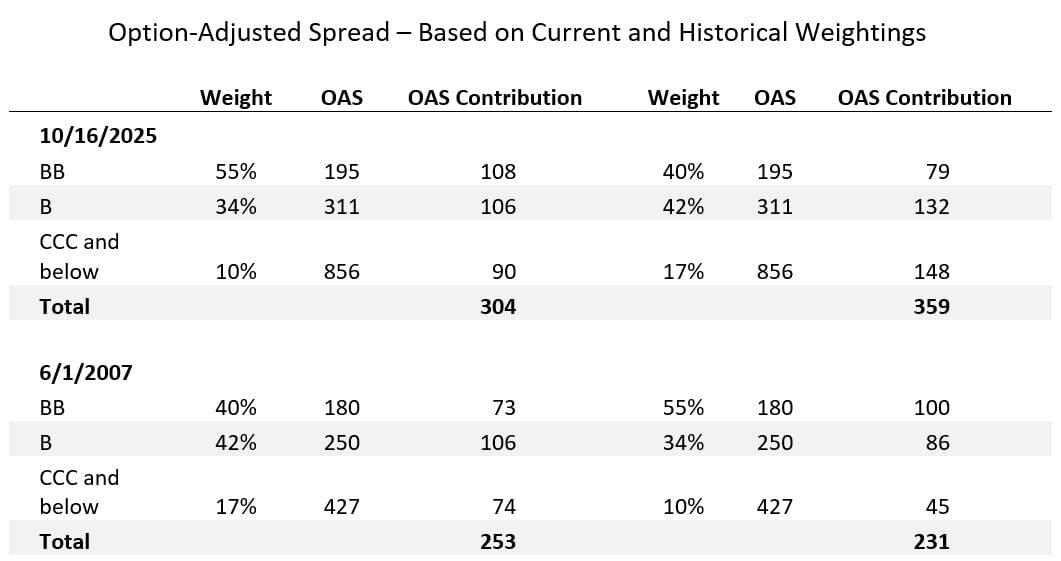
Similarly, index-level spreads can oversimplify what is happening in the market. For example, the current spread level of the ICE BofA High Yield Index is near its all-time low, suggesting that credit risk is also near a low point. But when we look at the index broken out by rating, we see a much different picture. Spreads are in fact quite tight for BBs and BBBs, the two highest rating categories, but for CCCs they are substantially wider, reflecting the drop-off in credit quality. As the table below shows, CCC spreads are in the 73rd percentile over the past 20 years, compared to the 95th and 100th for BBs and Bs, respectively.
* Based on quarterly data. Source: ICE BofA
Another limitation of index-level spreads is that they are difficult to compare across longer time horizons, as index compositions can change. For example, as we have discussed previously, the quality of the high yield bond market has improved substantially since the Great Financial Crisis, and the ICE BofA High Yield Index looks very different than it did in 2008. Today it is much more heavily weighted in the highest rating category (BB), while the lowest rating categories combined (CCC and below) have been nearly cut in half.
This re-weighting needs to be considered when comparing the spread of the index over time, as it is not an apples-to-apples comparison. As you can see in the table below, the high yield index spread is currently at 304 basis points, which makes it appear close to the 2007 level of 253 basis points.
However, if we were to take the weightings of the index from 2007 and apply 2025 spreads (by rating category), it would equate to an index spread of 359 basis points today. Conversely, if we were to apply today’s weightings to 2007, the spread would have been 231 basis points.
Source: Bloomberg
Where does this leave us? At the end of the third quarter, yields for the high yield index were 7.1%, which was the 40th percentile for the past 20 years. As value investors, we would always prefer to buy quality companies at higher yields, but from an absolute return perspective, these levels are still creating good opportunities for the portfolio and are not flashing signs of a bubble. In addition, between 1995 – 2025, the average 1-year forward return in periods that started with a 7% or higher yield is much better than the average for periods that started with a sub-7% yield.2
Still, we caution against making investment decisions based on a single factor. In our view, flexible, actively managed portfolios that consider the economic and market cycle work better than strategies with rigid, preset triggers.
—
Originally Posted on December 4, 2025 – To Meet Your Investment Goals, Focus on Yields Rather Than Spreads
1 Interestingly, spreads begin to lose their efficacy when a company is in distress. In these situations, the issuer’s bonds (and credit default swaps) move from trading on spread to trading on price. In other words, investors begin focusing on the borrower’s probability of default, and the underlying risk-free rate plays no role in determining the market price.
2 This statement is based on monthly data for the ICE BofA High Yield Index for the period 12/31/1994 through 10/31/2025. Past performance does not guarantee future results.
Information posted on IBKR Campus that is provided by third-parties does NOT constitute a recommendation that you should contract for the services of that third party. Third-party participants who contribute to IBKR Campus are independent of Interactive Brokers and Interactive Brokers does not make any representations or warranties concerning the services offered, their past or future performance, or the accuracy of the information provided by the third party. Past performance is no guarantee of future results.
This material is from Osterweis Capital Management and is being posted with its permission. The views expressed in this material are solely those of the author and/or Osterweis Capital Management and Interactive Brokers is not endorsing or recommending any investment or trading discussed in the material. This material is not and should not be construed as an offer to buy or sell any security. It should not be construed as research or investment advice or a recommendation to buy, sell or hold any security or commodity. This material does not and is not intended to take into account the particular financial conditions, investment objectives or requirements of individual customers. Before acting on this material, you should consider whether it is suitable for your particular circumstances and, as necessary, seek professional advice.
Trading on margin is only for experienced investors with high risk tolerance. You may lose more than your initial investment. For additional information regarding margin loan rates, see ibkr.com/interest


Join The Conversation
For specific platform feedback and suggestions, please submit it directly to our team using these instructions.
If you have an account-specific question or concern, please reach out to Client Services.
We encourage you to look through our FAQs before posting. Your question may already be covered!