
- Solve real problems with our hands-on interface
- Progress from basic puts and calls to advanced strategies
Interactive Options Course
Posted November 7, 2025 at 11:00 am
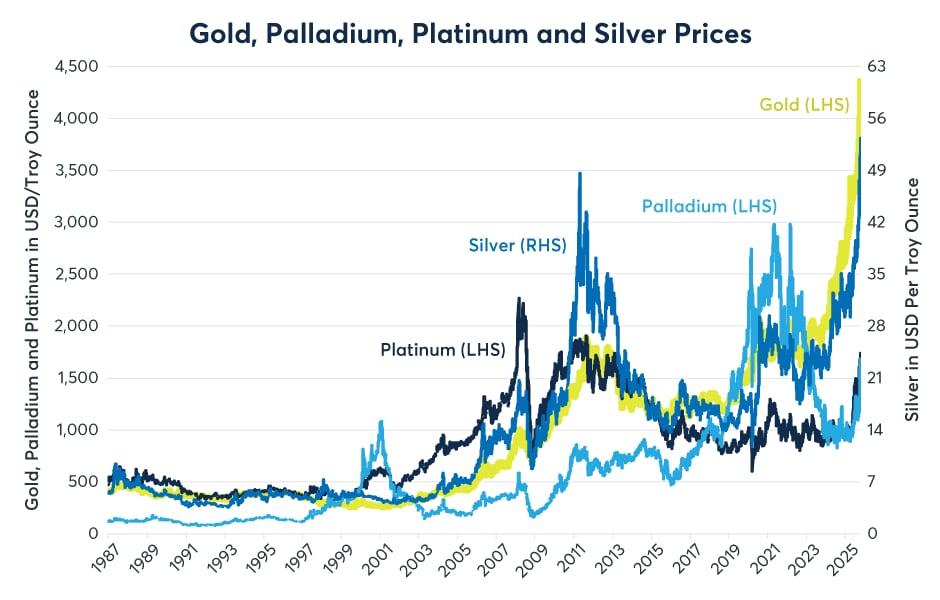
Between early April and October 2025, palladium prices rose over 95% from $870 to nearly $1,700 per troy ounce, rising in lockstep with gold, silver and platinum over the same period. Prices for all four metals, however, corrected sharply in late October.
The global inflation narrative that fueled the rally has three primary elements:
While palladium appeared to be highly correlated with its fellow precious metals in recent weeks, this has not always been the case. In fact, palladium, more so than the others, tends to dance to the beat of its own drummer (Figure 1). Unlike platinum, which hit all-time highs in 2008, or gold and silver, which hit their all-time highs in October 2025, palladium peaked in 2021 and 2022.
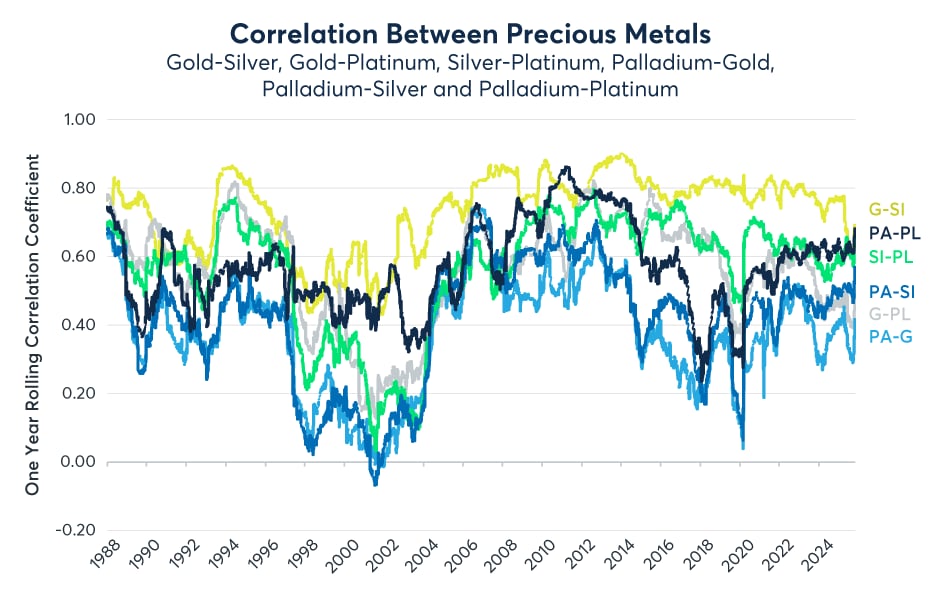
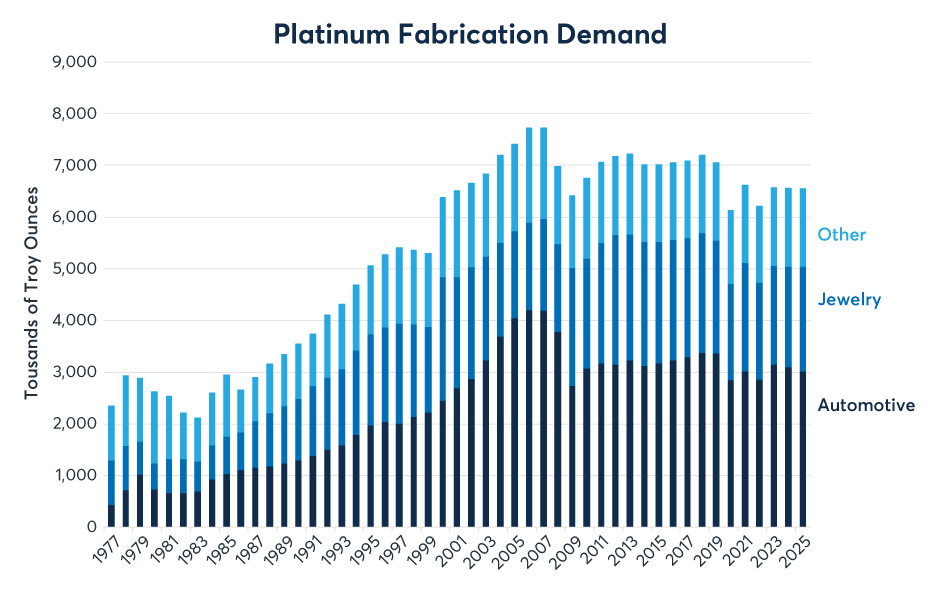
Palladium nearly always has a positive correlation with the other precious metals but the strength of those relationships tends to be relatively weaker than the other precious metals. Among the precious metals, gold and silver typically have the strongest correlation, which is driven by demand for jewelry. By contrast, platinum tends to have a stronger correlation with both silver and gold than palladium, perhaps in part because platinum, unlike palladium, is commonly used to make jewelry. That said, the second strongest correlation among the precious metals is between palladium and platinum, which reflects their use in catalytic converters; palladium for gasoline engines and platinum for diesel engines (Figures 2-4).
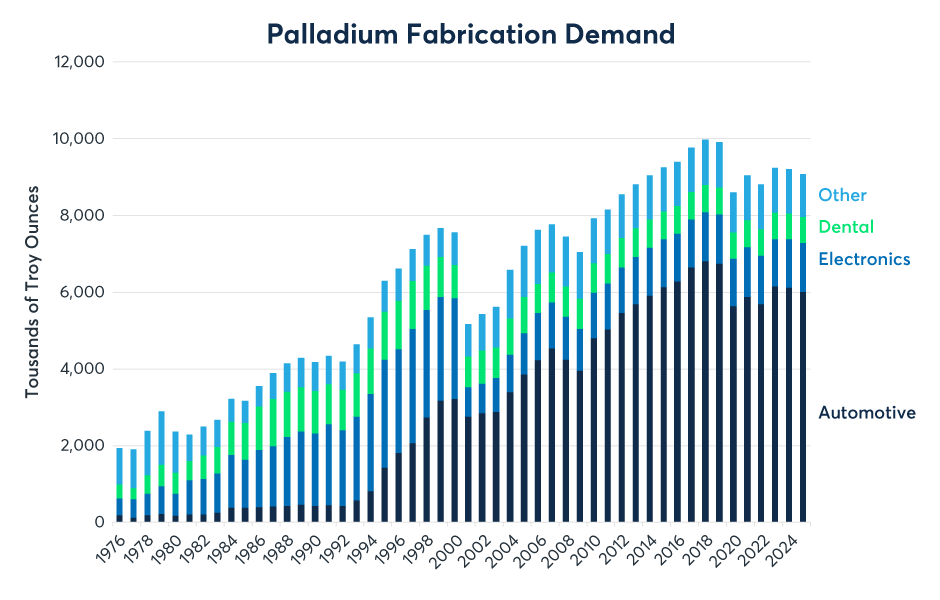
Of the two, palladium is the more dependent on the automobile sector since it is rarely used in jewelry, although it does have some applications in electronics and dentistry. A look at palladium’s price ratios to the other three metals highlights its tendency to move to its own beat (Figure 5).
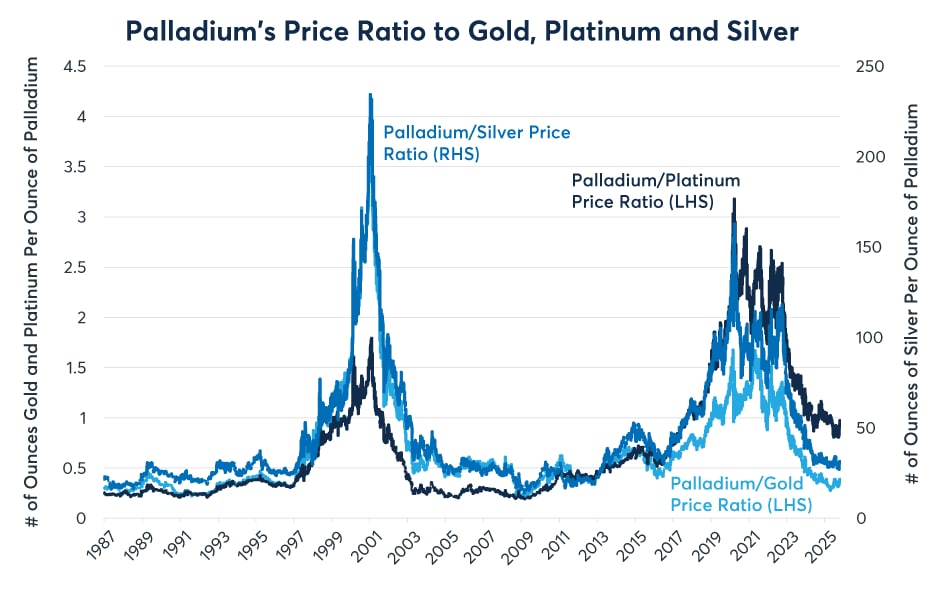
Between 1987 and 1996, one ounce of palladium bought around 0.3 ounces of platinum, which was the most expensive metal at the time, and around 0.5 ounces of gold. Starting in 1997, palladium began to rally and by 2000 one ounce of palladium bought as many as 1.8 ounces of platinum and up to four ounces of gold. Palladium’s strong performance versus its peers during this period was driven by a supply-side panic owing to both the automotive industries’ need for the metal and its concentrated supply in Russia (Figure 6).
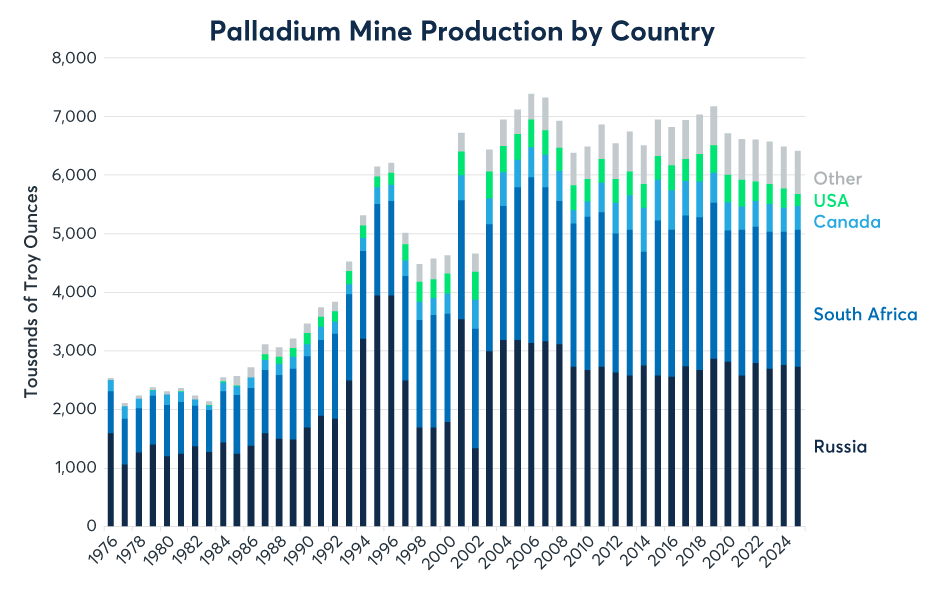
Following the collapse of the Soviet Union in 1991, Russia’s system for exporting the metal often produced delays related to paperwork and quotas. Carmakers and speculators feared that Russian supplies could stop flowing entirely. Panic buying, combined with growing demand from stricter auto-emission laws, produced a parabolic increase in palladium prices. Since the late 1990s, palladium mining production has diversified with South Africa increasing its proportion of output. That said, primary production remains heavily concentrated in Russia and South Africa. It’s also worth pointing out that mining output has generally been falling since 2003.
Palladium’s price ratio to the other precious metals fell precipitously between 2001 and 2003 as Russia’s supply issues were resolved. For the next dozen years palladium’s price ratio with respect to gold, silver and platinum settled at close to its pre-1997 range.
In the mid-2010s, however, palladium prices again began to outpace its peers as consumers shifted away from diesel towards gasoline-powered engines. This favored palladium over platinum, and it occurred as the world economy entered a stronger phase of growth as the global financial crisis faded into the background (Figure 7). Additionally, supply constraints in South Africa, owing to strikes and electricity blackouts, also boosted palladium prices.
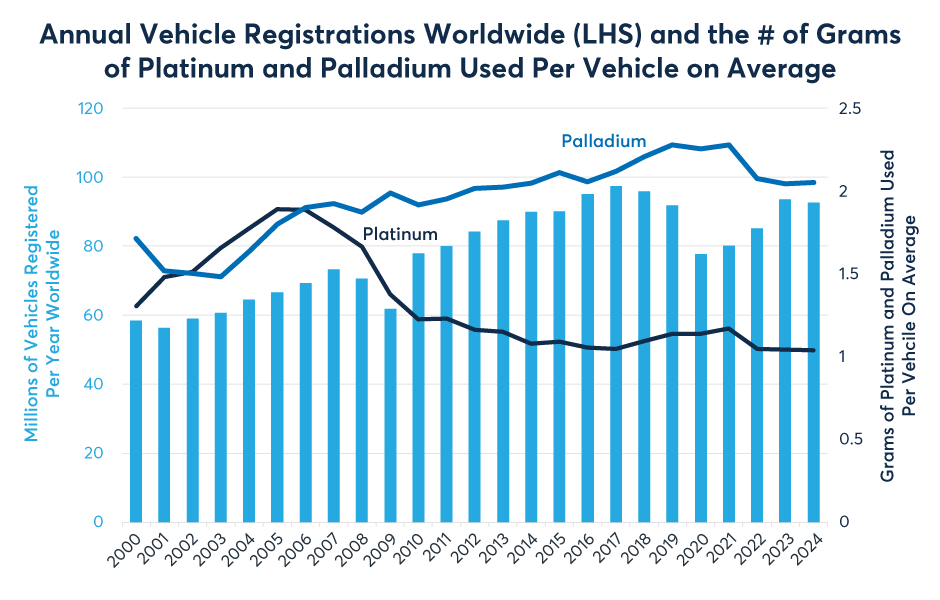
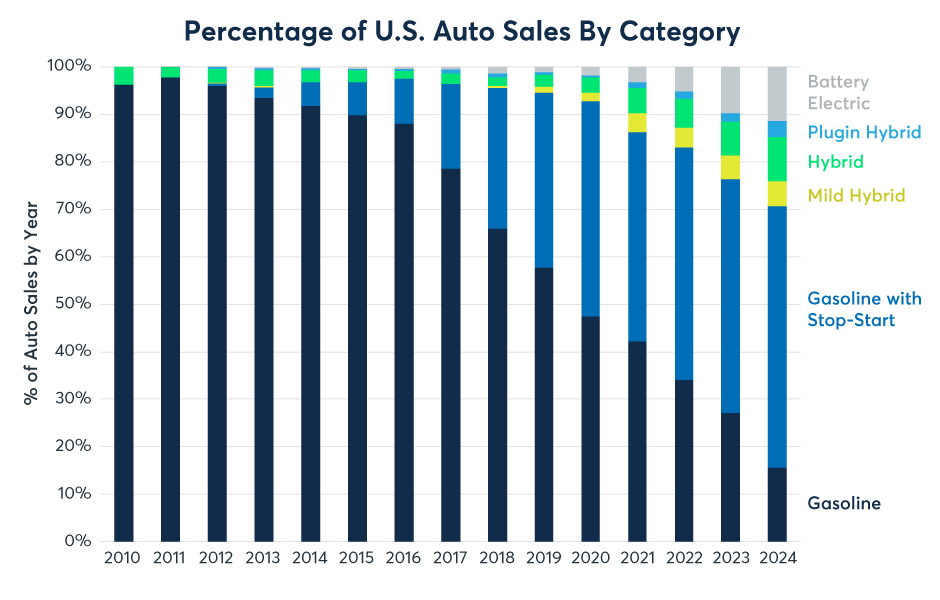
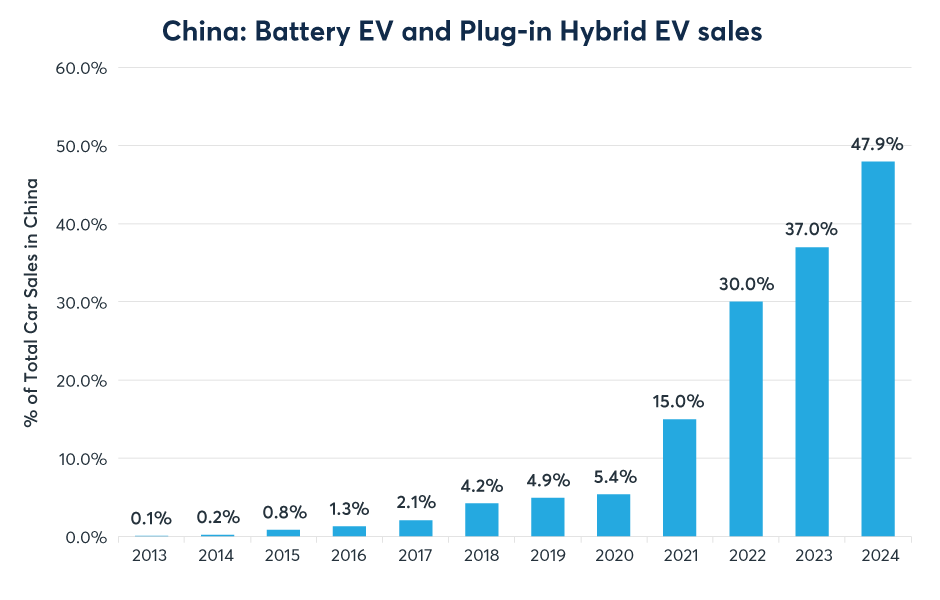
Since 2021, palladium prices have fallen back in the direction of their previous price ratios with gold, silver and platinum. This coincided with a peak in the palladium content of the average vehicle being sold, which itself relates to the surging sales of EVs. In the U.S., EV sales rose to 11.4% of total car sales in 2024 (Figure 8) while EV sales were nearly 50% of total car sales in China that same year (Figure 9).
China and the U.S. both reduced subsidies for buying EVs in 2025. Whether such policy changes produce enough of a shift in buying patterns remains to be seen.
At a minimum, palladium’s positive but relatively weak correlation with gold and silver as well as its limited mining output, make it interesting to look at as a potential portfolio diversifier for investors seeking exposure to precious metals and other assets that central banks cannot print, or digitally create.
—
Originally Posted November 5, 2025 – Will Ending of EV Subsidies Impact Palladium Demand, Prices?
© [2023] CME Group Inc. All rights reserved. This information is reproduced by permission of CME Group Inc. and its affiliates under license. CME Group Inc. and its affiliates accept no liability or responsibility for the information contained herein, including but not limited to the currency, accuracy and/or completeness of this information, and delays, interruptions, errors or omissions. This information is an unofficial copy and may not reflect the official and accurate version. For the definitive and up-to-date version of any of this information, please see cmegroup.com.
Information posted on IBKR Campus that is provided by third-parties does NOT constitute a recommendation that you should contract for the services of that third party. Third-party participants who contribute to IBKR Campus are independent of Interactive Brokers and Interactive Brokers does not make any representations or warranties concerning the services offered, their past or future performance, or the accuracy of the information provided by the third party. Past performance is no guarantee of future results.
This material is from CME Group and is being posted with its permission. The views expressed in this material are solely those of the author and/or CME Group and Interactive Brokers is not endorsing or recommending any investment or trading discussed in the material. This material is not and should not be construed as an offer to buy or sell any security. It should not be construed as research or investment advice or a recommendation to buy, sell or hold any security or commodity. This material does not and is not intended to take into account the particular financial conditions, investment objectives or requirements of individual customers. Before acting on this material, you should consider whether it is suitable for your particular circumstances and, as necessary, seek professional advice.
Related Articles


Join The Conversation
For specific platform feedback and suggestions, please submit it directly to our team using these instructions.
If you have an account-specific question or concern, please reach out to Client Services.
We encourage you to look through our FAQs before posting. Your question may already be covered!