
- Solve real problems with our hands-on interface
- Progress from basic puts and calls to advanced strategies
Interactive Options Course

Posted March 11, 2026 at 11:15 am
On February 28, the United States and Israel launched coordinated strikes against Iran. Among the targets was Supreme Leader Ali Khamenei, whose assassination marks the most consequential political shock in the Middle East since the fall of Saddam Hussein. His removal introduces deep uncertainty about the regime’s stability, its command over regional proxies, and the path of escalation. This transforms the episode from a military exchange into a potential inflection point in the region’s political order.
Iran retaliated by striking Gulf energy infrastructure – including Saudi Arabia’s Ras Tanura refinery – and declared the Strait of Hormuz closed. At least five tankers have been hit, insurers have pulled coverage, and commercial shipping through the strait has effectively ceased. The conflict has since spread to Kuwait, Bahrain, Lebanon, and the UAE, with Gulf airports suspending operations and US officials warning the campaign could last weeks.
Markets responded immediately:
The most revealing signal, however, may be onchain.
Within 48 hours of the strikes, Bitcoin flows off Iranian exchanges into self-custody surged roughly 700% above the prior baseline – a pattern previously observed during the country’s 2024 protest wave. In absolute terms, roughly $10.31 million1 moved in that window; in a country that processed an estimated $7.8 billion2 in crypto activity last year, the significance lies not in the dollar amount but in the velocity of the shift. Iran’s parallel financial infrastructure is activating.
One dimension of that infrastructure carries a note of caution: an estimated $1 billion3 in Iranian crypto activity has been linked to networks associated with the Islamic Revolutionary Guard Corps (IRGC). This matters less as a headline risk than as a structural one – the prospect of sanctions-linked flows touching regulated venues could complicate the institutional access story if enforcement actions follow. It is worth monitoring, though illicit crypto activity continues to decline as a share of total volume, falling from 1.3% in 2024 to 1.2% in 20254.
Markets don’t price conflicts; they price consequences. The Iran shock carries implications across energy markets, monetary policy, and the broader regional order. For Bitcoin, the most immediate transmission runs through oil: less crude flowing through the Strait of Hormuz means higher energy prices, stickier inflation, and a Federal Reserve with less room to ease.
The Strait of Hormuz carries roughly 20%5 of global oil consumption and a similar share of Liquefied Natural Gas (LNG) trade. With tankers going dark and insurers withdrawing coverage, shipping through the strait has been severely disrupted. Markets have reacted quickly: In less than a week, Brent is up 13% to $84 – a move larger than about 99% of five-day oil price increases over the past decade. The five-day comparison reflects that the bulk of the move has occurred within the past week, while European gas futures have jumped roughly 30% and LNG freight rates have surged more than 40%6.
The key question is how the current disruption compares with previous Hormuz scares. Previous Hormuz scares faded quickly because shipping never fully stopped. The 2019 tanker attacks only briefly lifted oil prices. The Abqaiq strike temporarily knocked out half of Saudi processing capacity, sending Brent up 15%, but prices normalized within weeks once repairs began. Even the June 2025 US-Israel strikes pushed crude only briefly toward $80 before tensions cooled7.
This conflict is fundamentally different. Previous shocks targeted facilities that could be repaired; this one targets both the route and the regime. The assassination of Iran’s supreme leader makes rapid de-escalation far less likely than in any prior episode, and the longer the disruption lasts, the more markets will begin pricing the consequences of a sustained energy supply shock.
History shows what that repricing looks like:
The magnitude varies with the monetary regime, but the pattern is consistent: sustained energy shocks, particularly when they coincide with fiscal and monetary stress, push capital toward scarce, non-sovereign assets. That sequence is where Bitcoin enters the picture – not as a reflexive risk-off trade, but at the end of a chain where capital seeks non-sovereign stores of value.
In the 1970s, gold was the only liquid destination for those flows. Today, Bitcoin sits alongside it – arguably better suited to a world where the repricing happens faster and capital moves digitally.
This supply shock arrives at a genuinely difficult moment for the US economy, and the correct label for what is emerging is stagflation risk: slowing growth coinciding with an energy-driven inflation impulse that the Fed cannot offset without worsening the growth side of the trade-off.
The numbers support the concern. US PCE inflation is currently running at 2.9%9, above the Fed’s 2% target and well above the roughly 1.5-1.7% average of the pre-pandemic decade. Q4 GDP growth came in at just 1.4%, below expectations. A 10% increase in oil prices has historically added roughly 0.15–0.2%10 to PCE inflation within three to six months. At current Brent levels, that transmission is already in motion.
Markets have largely concluded that near-term easing is off the table. Fed funds futures now price just a 2% probability of a March cut. The probability of the Fed holding through both April and June has risen from 75% to 85%11. since the strikes, pushing the first expected move to July. At $100 oil, the trade-off becomes much starker: containing inflation takes clear priority over supporting growth, delaying easing, and keeping real yields and financial conditions tighter for longer.
Assets sensitive to liquidity conditions will feel that pressure. Bitcoin is among them and has traded with meaningful sensitivity to liquidity throughout this cycle. That sensitivity cuts both ways: it creates near-term headwinds but also makes Bitcoin a direct beneficiary when the easing cycle eventually arrives.
Markets initially responded along the familiar lines of a geopolitical shock, but the cross-asset reaction suggests investors are increasingly viewing the escalation through an inflation lens.
Equities sold off sharply before stabilizing into the close. At Tuesday’s lows, the Dow had fallen by more than 1,200 points, and the S&P 500 dropped by roughly 2.5% intraday. Both Monday and Tuesday followed the same pattern: sharp declines met with buying on weakness. Markets are unsettled, but still absorbing the shock rather than breaking down.
The bond market told a clearer story. The US 10-year Treasury yield climbed back above 4%, its largest daily move since October. In a typical geopolitical crisis, yields fall as investors seek safety in government bonds. This time they rose, suggesting markets are pricing the shock primarily as energy-driven inflation rather than a flight to safety.
Volatility confirmed the shift. The VIX spiked above 27, its highest since November 2025, when AI valuation fears and the end of the government shutdown drove uncertainty. It remains elevated, signaling that investors expect sustained turbulence rather than a short-term dislocation.
Bitcoin fell from $70,000 to $63,000 over the weekend due to thin liquidity but stayed within the February range. On Monday, it briefly dipped to $66,000 before recovering toward $68,000 while equities remained near session lows. If it continues to hold above $65,000 as equities weaken, markets may begin to reprice it as a hard asset. A further risk lies in regime fragmentation: if proxy networks begin to act without centralized command, uncertainty rises in how this conflict is contained.
Healthier market structure: Unlike prior shocks, this conflict hit a market already flushed of speculative excess:
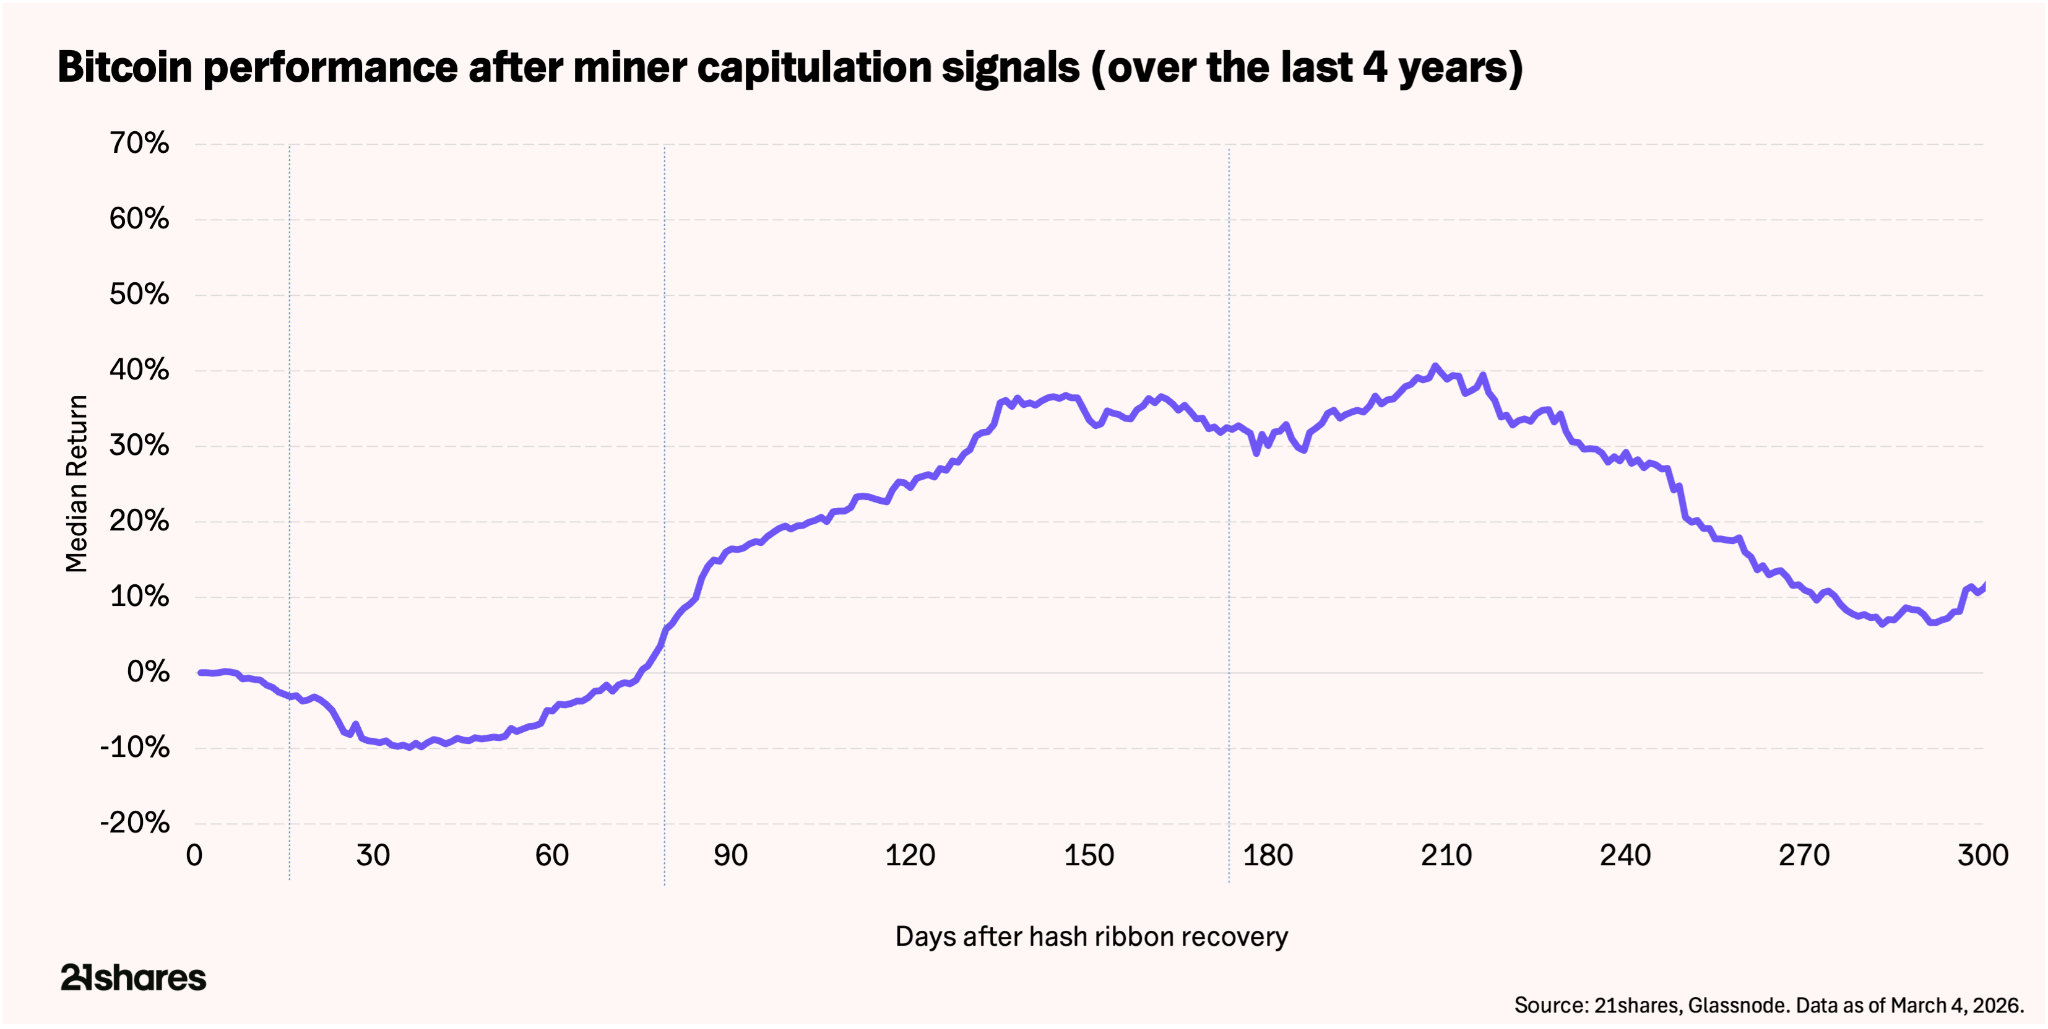
Miner capitulation nearing its end: The Hash Ribbon indicator is approaching a recovery signal after nearly three months of capitulation. Over the past four years, similar signals have been followed by median bitcoin returns of roughly 16% over three months, 32% over six months, and nearly 60% over the following year. The signal does not necessarily mark the exact bottom, but it has historically appeared during periods when selling pressure from miners is largely exhausted, and accumulation phases begin.
Institutional flows: US spot Bitcoin ETFs recorded nearly $1 billion in net inflows between March 2 and 4, breaking a four-week outflow streak. This is despite the average ETF holder sitting roughly 25% below entry price – which echoes that Institutions are adding exposure, not exiting.
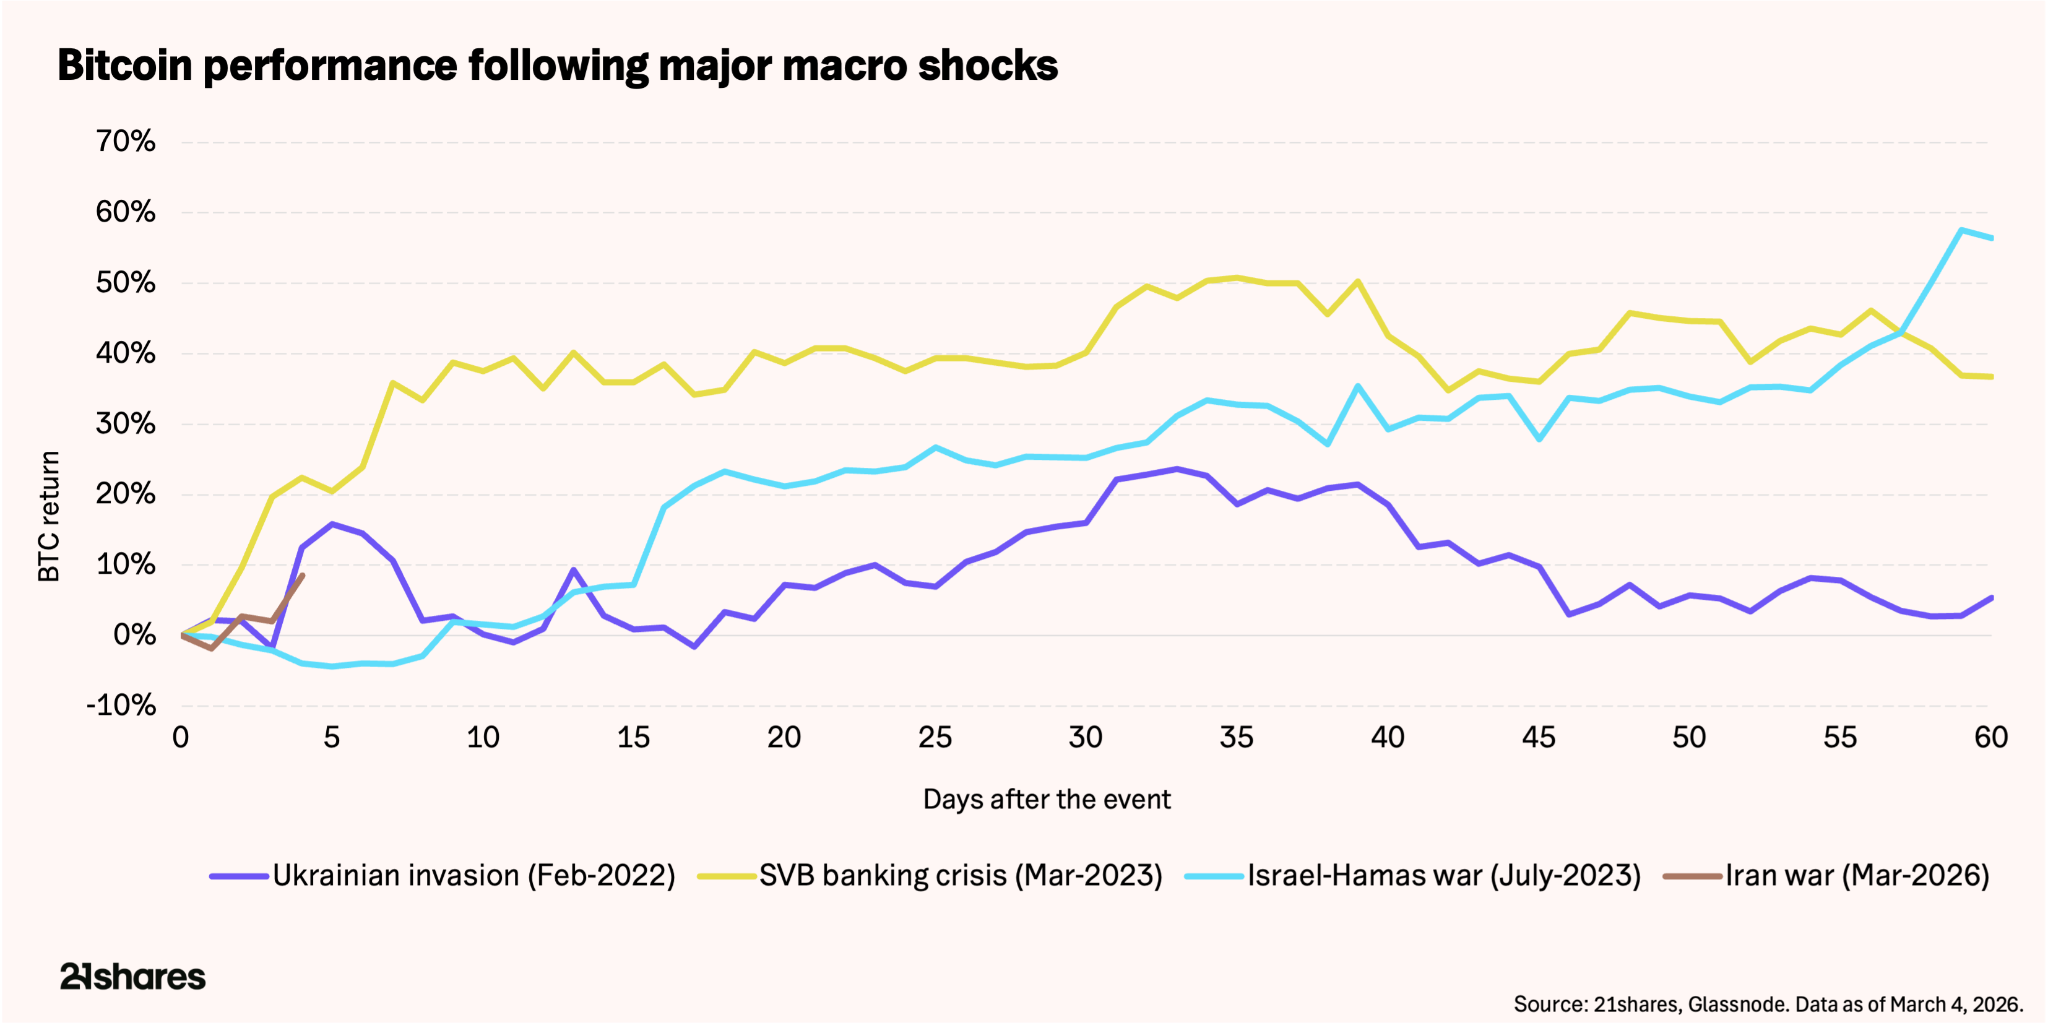
The structural case strengthens: Geopolitical shocks have consistently produced sharp drawdowns in bitcoin, followed by rapid recoveries:
Liquidity shocks create the entry point; structural repricing follows. The same drivers are emerging again: rising fiscal commitments, constrained monetary policy, and growing demand for non-sovereign assets. Gold already reflects that shift. Bitcoin, which shares many of those properties with greater upside asymmetry, has not yet repriced.
The scenarios below map the range of outcomes from here, ordered by severity:
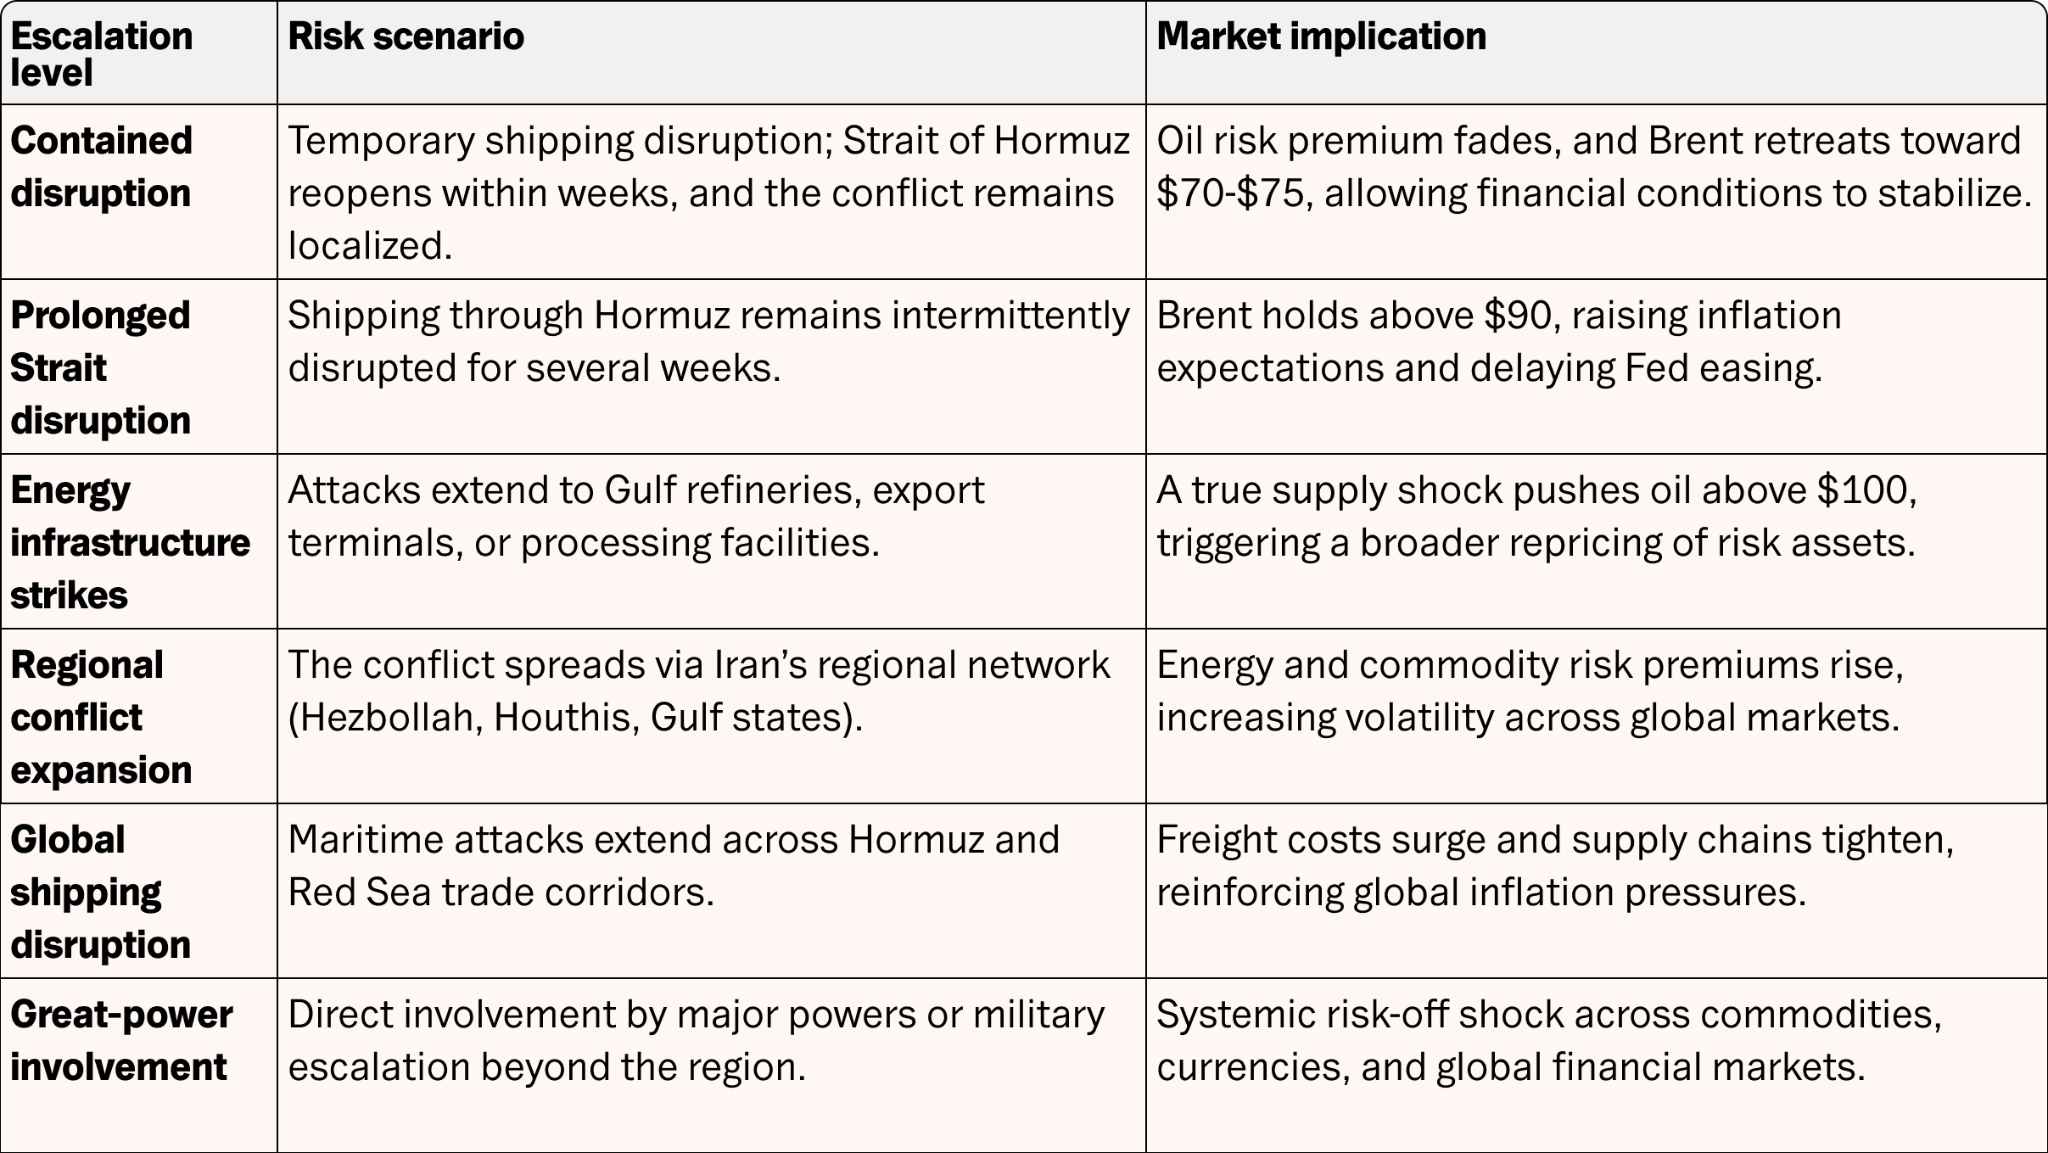
The scenarios above are not mutually exclusive. A contained disruption can shift to a prolonged one if proxy networks escalate without centralized Iranian command. The key variable to watch is not Iranian military capability – it is whether there is a successor authority capable of negotiating. Until that question resolves, duration risk is systematically underpriced across all scenarios.
—
Originally Posted March 9, 2026 – Regime change, oil shock, and Bitcoin’s inflection point
Footnotes:
Information posted on IBKR Campus that is provided by third-parties does NOT constitute a recommendation that you should contract for the services of that third party. Third-party participants who contribute to IBKR Campus are independent of Interactive Brokers and Interactive Brokers does not make any representations or warranties concerning the services offered, their past or future performance, or the accuracy of the information provided by the third party. Past performance is no guarantee of future results.
This material is from 21shares and is being posted with its permission. The views expressed in this material are solely those of the author and/or 21shares and Interactive Brokers is not endorsing or recommending any investment or trading discussed in the material. This material is not and should not be construed as an offer to buy or sell any security. It should not be construed as research or investment advice or a recommendation to buy, sell or hold any security or commodity. This material does not and is not intended to take into account the particular financial conditions, investment objectives or requirements of individual customers. Before acting on this material, you should consider whether it is suitable for your particular circumstances and, as necessary, seek professional advice.
Trading in digital assets, including cryptocurrencies, is especially risky and is only for individuals with a high risk tolerance and the financial ability to sustain losses. Eligibility to trade in digital asset products may vary based on jurisdiction.
Cryptocurrency based Exchange Traded Products (ETPs) are high risk and speculative. Cryptocurrency ETPs are not suitable for all investors. You may lose your entire investment. For more information please view the RISK DISCLOSURE REGARDING COMPLEX OR LEVERAGED EXCHANGE TRADED PRODUCTS.
Futures are not suitable for all investors. The amount you may lose may be greater than your initial investment. Before trading futures, please read the CFTC Risk Disclosure. A copy and additional information are available at ibkr.com.
U.S. Spot Gold trading through IB LLC accounts is only available to legal residents of the United States that do not reside in Arizona, Montana, New Hampshire, and Rhode Island.
Investments in certain commodities (precious metals) may be subject to significant price volatility and often involve risks related to market fluctuations, liquidity constraints, geopolitical events, and changes in global economic conditions that could adversely affect their value.
Related Articles


Join The Conversation
For specific platform feedback and suggestions, please submit it directly to our team using these instructions.
If you have an account-specific question or concern, please reach out to Client Services.
We encourage you to look through our FAQs before posting. Your question may already be covered!