
- Solve real problems with our hands-on interface
- Progress from basic puts and calls to advanced strategies
Interactive Options Course

Posted May 11, 2026 at 12:57 pm
(Today’s Theme Music: The artist formerly known as “the artist formerly known as” Prince.)
We have previously noted, most recently last week, that there seemed to be a generational difference of opinion among investors. Those who went through the internet bubble are more likely to ask me whether the current market runup is reminiscent of that era. Those who are younger – particularly those who began investing after the Global Financial Crisis (GFC) – are far less apt to raise concerns of that type. That does not preclude the latter group from asking why the former might be expressing concerns. Today’s piece hopes to reconcile those views.
Let me preface this by noting that both attitudes – both nervous and sincerely skeptical about that nervousness – are equally valid. Let’s also stipulate that while “this time it’s different” is often considered the most dangerous phrase in investing, it can be equally perilous to draw inappropriate parallels. Hopefully it is easier to try to answer this question: why do people compare today’s market to that of 1999-2000?
6-Months, NDX (red/green candles), SPX (blue line)
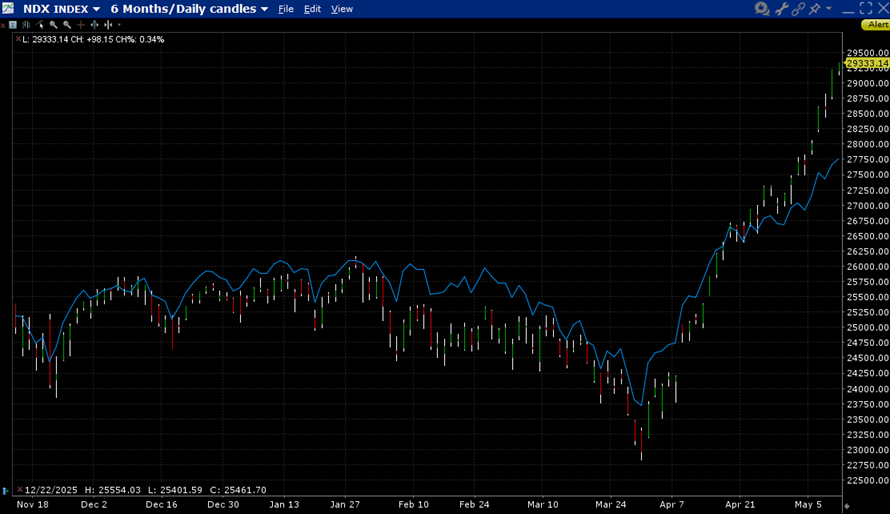
Source: Interactive Brokers
6-Months, NDX (red/green candles), SPX (blue line), SOX (purple line)

Source: Interactive Brokers
It is understandable why seeing a 70% rally in SOX in under six weeks might cause some to consider whether we have come too far too fast, especially when memories of the following chart are etched in some older folks’ minds.
NDX Index, Jan 1, 1999 to May 11, 2000, with 50-day moving average

Source: Bloomberg
The rally in NDX from October 1999 to March 2000 surpassed the current 70% mark. If we take the starting point at around 2400, the first 70% gain was at about 4000. There was another 20% left to run. But the current SOX and historic NDX seem at least similar.
My conclusion. History doesn’t repeat but it often rhymes. Like most hit songs, including Prince’s, I hear quite a bit of rhyming, if not repetition.
Bear in mind that Prince actually had one of the most prescient market calls of all time:
Say say two thousand zero zero party over, oops, out of time
So tonight I’m gonna party like it’s nineteen ninety-nine
OK, so that call was at least 17 years too early. The album “1999” was released in October 1982, just two months after the start of a great bull market. But stock traders did party in 1999 and then oops, out of time. What a party it was. And then, as now, it’s impossible to know when it might end and how bad the hangover might be.
For specific platform feedback and suggestions, please submit it directly to our team using these instructions.
If you have an account-specific question or concern, please reach out to Client Services.
We encourage you to look through our FAQs before posting. Your question may already be covered!
The analysis in this material is provided for information only and is not and should not be construed as an offer to sell or the solicitation of an offer to buy any security. To the extent that this material discusses general market activity, industry or sector trends or other broad-based economic or political conditions, it should not be construed as research or investment advice. To the extent that it includes references to specific securities, commodities, currencies, or other instruments, those references do not constitute a recommendation by IBKR to buy, sell or hold such investments. This material does not and is not intended to take into account the particular financial conditions, investment objectives or requirements of individual customers. Before acting on this material, you should consider whether it is suitable for your particular circumstances and, as necessary, seek professional advice.
The views and opinions expressed herein are those of the author and do not necessarily reflect the views of Interactive Brokers, its affiliates, or its employees.
Options involve risk and are not suitable for all investors. For information on the uses and risks of options, you can obtain a copy of the Options Clearing Corporation risk disclosure document titled Characteristics and Risks of Standardized Options by going to the following link ibkr.com/occ. Multiple leg strategies, including spreads, will incur multiple transaction costs.
Investments in certain commodities (precious metals) may be subject to significant price volatility and often involve risks related to market fluctuations, liquidity constraints, geopolitical events, and changes in global economic conditions that could adversely affect their value.
Related Articles


I am using the newer IBKR desktop, and I have noticed that when I pull up a daily chart of a futures contract, there are gaps in the chart. When I pull up the same chart for intra day (like 4 hour) the gaps are gone. For some reason, this new desktop platform does not pickup the night session trade on the daily chart. It does not even give me the option to switch between sessions at the bottom right corner like it does with intra-day charts. Please let me know when this problem will be fixed. Also, I just moved a couple of accounts over to IBKR from Charles Schwab. I trade both stocks and futures. I notices on futures contracts that the margins are between 30 and 40 percent higher than what Schwab requires. Please provide me feedback on this please. Email: rodney@trustalliancecapital.com
For long term consistent savers, the “crash” of 2000 wasn’t the disaster it’s made out to be. Starting in about 1985 a percentage of my check (along with employer match) went into my 401K twice a month. So, in the 2000 “crash” my total saving were back to the prior year level. Disappointing, but I wasn’t thinking of jumping off a building or anything. Then the market was flat for a couple years, and then back up. Then 2008 came along. That was actually more scary, but I didn’t change anything. Just kept the paycheck by paycheck contributions going. Retired in 2017. Saw some pretty good drawdowns since then. I haven’t even blinked. Closing in on an 8 figure nest egg. If that dips back into low 7 figures, so be it. Don’t worry. Be happy.
Agree, for the majority of investors who are, or should be, concerned about the long term. I retired in 2020 and used my SPDR investment to buy a nice house for cash. I had also been doing dollar-cost averaging for decades as my primary “strategy”.
In inflation-adjusted terms, Cisco has never gotten back to its dot-com era high. Not even close.
I have to agree. Timing the market is fools play. I’ve thought it’s been overvalued for many years and if I acted on that it would have been a shame. Likewise when I feel it’s undervalued I won’t change my approach and keep the same allocation to public equities