
- Solve real problems with our hands-on interface
- Progress from basic puts and calls to advanced strategies
Interactive Options Course

Posted August 12, 2026 at 10:31 am
Seasonality in financial markets is commonly used by investors to identify recurring market trends over specific periods of the year. However, historical data can also be analyzed on a much shorter time horizon, potentially highlighting individual trading days in which stocks or indices have shown a statistically significant tendency to move in a particular direction.
This article explores a systematic approach based on historical probabilities, focusing on days that have displayed a consistent directional pattern across multiple observation periods. Rather than relying on discretionary chart analysis, the methodology uses 10-, 15-, and 20-year historical data to identify recurring short-term market behaviors.
The analysis is conducted using Forecaster, a financial analysis platform that combines seasonality, technical indicators, fundamental data, financial statements, and AI-powered tools. For the purpose of this strategy, however, the focus will be exclusively on its seasonality module and on how historical statistics can be translated into a structured short-term trading framework.
The premise of this strategy is to identify specific days of the year when a stock or index has an overwhelming historical probability of moving in a certain direction. We are not guessing; we are looking at hard data from the past.
To start, you jump into the Forecaster terminal and select the instrument you want to trade. The very first crucial step is to activate the 10, 15, and 20-year seasonality data, completely deactivating all other timeframes.

Why not look at 30 years of history? We have conducted extensive testing, and the data clearly shows that 30 years is too far back. The market dynamics were simply too different three decades ago. The sweet spot for reliable statistical recurrence is the combination of the 10, 15, and 20-year windows.
The golden rule of this strategy is uncompromising: we only consider trading a specific day if the probability of a historical directional move (either long or short) is strictly greater than 70% across ALL three timeframes (10, 15, and 20 years).
This strategy relies on deep historical data, meaning you must carefully select the assets you trade. We focus our attention on the 10 largest companies in the S&P 500 (like Nvidia, Alphabet, etc.) and the most important global indices, such as the S&P 500, the NASDAQ, and Europe’s DAX.
A critical warning: Do not use this strategy on recently listed companies. For instance, as much as you might want to trade Tesla using this method, Tesla simply does not have 20 years of trading history. Without that complete 10/15/20-year historical dataset, the statistical edge disappears. If we look at a stock like Eli Lilly, we might find that a date like August 7 shows a 77% probability on the 20-year timeframe, but if it doesn’t align perfectly above 70% on the other timeframes, we discard it and wait for a perfectly aligned date (like August 22).
Let’s look at a practical example using Nvidia. By checking our Forecaster statistics for the month of August, we identified two massively important setups:
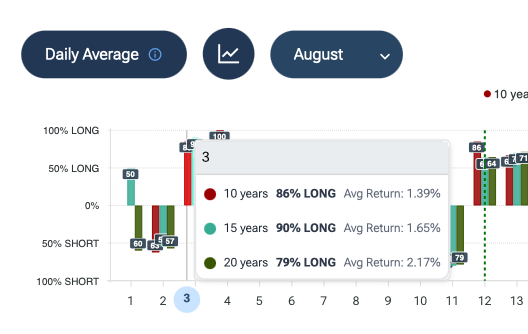
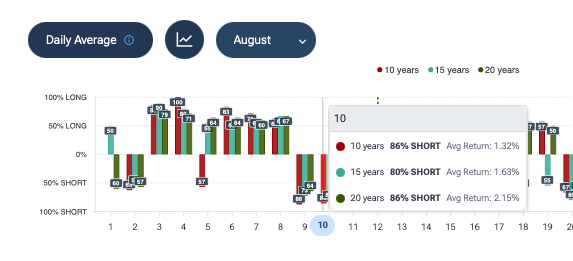
Knowing this in advance changes everything. You can literally map out your entire month of trading opportunities in just a few minutes. We use the Forecaster’s built-in calendar to log these dates—writing down “Negative day for Nvidia – Aug 10” or doing the same for Alphabet. Furthermore, we are integrating our AI Agent within the Forecaster to automatically alert us when these high-probability days are approaching for major stocks.

Knowing what day to trade is only half the battle; knowing when to enter the market maximizes your edge. Let’s say we are looking at the S&P 500 for August 6th, which historically is a phenomenally bullish day (100% positive over 10 years, 80% over 15 years, 71% over 20 years).
Here are the mechanical rules for entry:
If the market is closed the day prior (e.g., a Sunday), you simply wait for the Monday morning open. In one of our Nvidia trades, the stock opened with a -0.91% gap down on our historically bullish day. Because the statistics were heavily on our side, we bought the dip instantly, and the stock rallied beautifully.
How do you exit the trade? Everything is dictated by the historical average returns provided by the software.
Let’s return to the Nvidia long setup. On average, the historical return for August 3rd is roughly 1.65%, and for August 4th, it is 1.73%. Because we had two highly probable bullish days back-to-back (a positive streak), we can confidently combine these expectations. By combining them, we set a Target Price of roughly +3% from our entry point.
Your Stop Loss is always set mechanically: we use exactly half of your target price. If your take-profit target is +3%, your stop loss is firmly placed at -1.5%. This ensures that your risk-to-reward ratio is always mathematically sound, protecting your capital when the statistics occasionally fail (because there is never a 100% guarantee in trading).
Do you need to check the company’s fundamental situation before executing these trades? Absolutely not. While fundamental analysis is crucial for long-term investing—and fully supported by the Forecaster—this specific strategy is a short-term, 24-to-48-hour statistical play. Unless a catastrophic Black Swan event happens, top 10 mega-cap stocks like Nvidia or Alphabet do not suddenly collapse overnight due to bad balance sheets. We strictly follow the probabilities.
Does this work on Forex currency pairs? While the statistical principles are universal, we do not currently use this on Forex. Currency markets operate on different 24-hour trading cycles compared to the distinct opening and closing bells of stocks and indices. Besides, equities and indices provide more than enough daily opportunities.
What else can this be applied to? This statistical edge is incredibly versatile. It works wonderfully on commodities. It is heavily utilized by our US-based users to trade Options, maximizing their leverage on these specific days. I have even successfully applied these exact same statistical probabilities to prediction markets like Polymarket!
By dedicating just a few minutes every week to scan the Forecaster and plot these dates on your calendar, you can build a robust, historically-backed trading routine that removes emotional guesswork and relies entirely on decades of hard data.
—
Originally Posted August 12, 2026 – Forecaster.biz
Information posted on IBKR Campus that is provided by third-parties does NOT constitute a recommendation that you should contract for the services of that third party. Third-party participants who contribute to IBKR Campus are independent of Interactive Brokers and Interactive Brokers does not make any representations or warranties concerning the services offered, their past or future performance, or the accuracy of the information provided by the third party. Past performance is no guarantee of future results.
This material is from Forecaster.biz and is being posted with its permission. The views expressed in this material are solely those of the author and/or Forecaster.biz and Interactive Brokers is not endorsing or recommending any investment or trading discussed in the material. This material is not and should not be construed as an offer to buy or sell any security. It should not be construed as research or investment advice or a recommendation to buy, sell or hold any security or commodity. This material does not and is not intended to take into account the particular financial conditions, investment objectives or requirements of individual customers. Before acting on this material, you should consider whether it is suitable for your particular circumstances and, as necessary, seek professional advice.
Options involve risk and are not suitable for all investors. For information on the uses and risks of options, you can obtain a copy of the Options Clearing Corporation risk disclosure document titled Characteristics and Risks of Standardized Options by going to the following link ibkr.com/occ. Multiple leg strategies, including spreads, will incur multiple transaction costs.
Related Articles

















Join The Conversation
For specific platform feedback and suggestions, please submit it directly to our team using these instructions.
If you have an account-specific question or concern, please reach out to Client Services.
We encourage you to look through our FAQs before posting. Your question may already be covered!