
- Solve real problems with our hands-on interface
- Progress from basic puts and calls to advanced strategies
Interactive Options Course
Posted May 19, 2025 at 11:35 am
The article “US Value Stocks Trading at Historically High Discounts” was originally posted on Alpha Architect blog.
For equity investors there have been two major narratives over the last 17 calendar year period 2008-2024. The first is that US stocks have far outperformed international stocks with the S&P 500 Index returning 10.7% per annum, the MSCI EAFE Index 3.3% per annum, and the MSCI Emerging Markets Index 1.9% per annum. The other narrative has been the outperformance of growth stocks relative to value stocks with the Russell 3000 Growth Index returning 13.0% per annum versus the 7.6% per annum return of the Russell 3000 Value Index. As the chart below from First Trust shows, much of that outperformance is explained by the change in valuations—the discount at which value stocks trade relative to growth stocks widened dramatically.
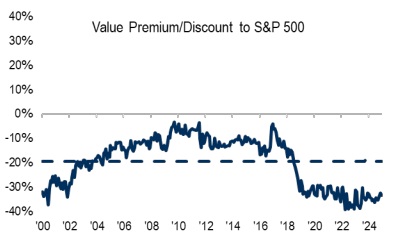
The results are hypothetical results and are NOT an indicator of future results and do NOT represent returns that any investor actually attained. Indexes are unmanaged and do not reflect management or trading fees, and one cannot invest directly in an index.
Source: Bloomberg & Capital IQ. Monthly data is calculated from 1/31/00 to 12/31/24. The value factor is comprised of the top 30% of stocks from a universe of the largest 1,000 U.S. stocks with at least $1 million dollars in average daily volume over the last 3 months and 12 months of trading history with value being determined by lowest price-to-book.
Another way to look at relative valuations is to compare current forward-looking P/E ratios. Here again we see growth stocks trading at historically very high valuations, while value stocks are trading at about their average valuation of the last 25 years (the spread in valuations has widened).
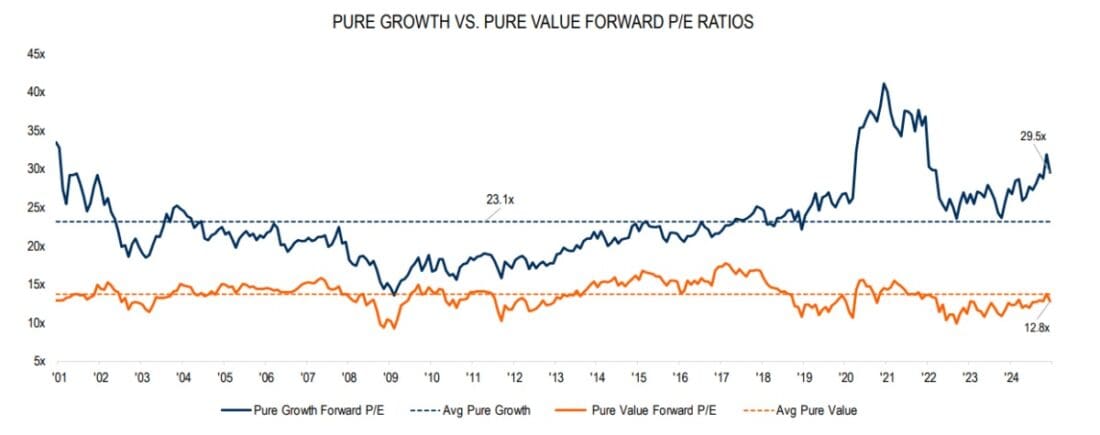
The results are hypothetical results and are NOT an indicator of future results and do NOT represent returns that any investor actually attained. Indexes are unmanaged and do not reflect management or trading fees, and one cannot invest directly in an index.
Source: Capital IQ. Monthly data is calculated from 12/29/00-12/31/24. Universe: largest 1,000 U.S. firms with $1 million in average daily volume over the last 3 months and 12 months of trading history. The median monthly forward price-to-earnings ratio is used for the pure growth and pure value baskets. Only firms with positive earnings are used. Pure growth names are the 30% of names with the highest price-to-books versus the pure value basket of the 30% of names with the lowest price-to-books.
What is important for investors to understand is that while valuations tell us little about returns over the short term (such as the next year), they are the best predictor we have of future long-term returns. Thus, just as the historically wide gap between the current high valuations of US stocks relative to international stocks suggests that international stocks are likely to provide higher future returns, the relatively high historical spread in valuations between value and growth stocks suggests that the value premium is likely to be higher than it has been historically.
History Lesson
The last time the discount in the valuation of value stocks versus growth stocks was this wide, was at around the turn of the century (around the time the dot.com bubble burst). The reversion to the mean of the historic valuation spread led to the dramatic outperformance of value stocks. For example, over the five-year period 2000-04, the Russell 3000 Value Index outperformed the Russell 3000 Growth Index by 15% per annum (-8.95% vs. 6.09%). That produced a total return difference of more than 93% (-19.4% vs. 73.9%).
While the future is unknowable, the best investors can do is to put the odds in their favor. And current valuations suggest the likelihood that value stocks will outperform over the long term.
Investor Takeaway
Don’t make the common mistake of being subject to recency bias, which causes investors to assume that the future will look like the recent past. That mistake leads them to buy what has outperformed (at relatively higher valuations, which predicts lower future returns) and sell what has underperformed (at lower relative valuations, which predicts higher future returns). Buying high and selling low is not exactly a prescription for success. Unfortunately, it is what the average individual investor does.
Larry Swedroe is the author or co-author of 18 books on investing. His latest is Enrich Your Future
The views and opinions expressed herein are those of the author and do not necessarily reflect the views of Alpha Architect, its affiliates or its employees. Our full disclosures are available here. Definitions of common statistics used in our analysis are available here (towards the bottom).
This site provides NO information on our value ETFs or our momentum ETFs. Please refer to this site.
Information posted on IBKR Campus that is provided by third-parties does NOT constitute a recommendation that you should contract for the services of that third party. Third-party participants who contribute to IBKR Campus are independent of Interactive Brokers and Interactive Brokers does not make any representations or warranties concerning the services offered, their past or future performance, or the accuracy of the information provided by the third party. Past performance is no guarantee of future results.
This material is from Alpha Architect and is being posted with its permission. The views expressed in this material are solely those of the author and/or Alpha Architect and Interactive Brokers is not endorsing or recommending any investment or trading discussed in the material. This material is not and should not be construed as an offer to buy or sell any security. It should not be construed as research or investment advice or a recommendation to buy, sell or hold any security or commodity. This material does not and is not intended to take into account the particular financial conditions, investment objectives or requirements of individual customers. Before acting on this material, you should consider whether it is suitable for your particular circumstances and, as necessary, seek professional advice.


Join The Conversation
For specific platform feedback and suggestions, please submit it directly to our team using these instructions.
If you have an account-specific question or concern, please reach out to Client Services.
We encourage you to look through our FAQs before posting. Your question may already be covered!