
- Solve real problems with our hands-on interface
- Progress from basic puts and calls to advanced strategies
Interactive Options Course

Posted September 18, 2026 at 11:15 am
An increasing number of my friends are nearing retirement if not already there. Many spent years working for large corporations, and few miss it. I have no similar plans – running your own business is the most meaningful paid activity I’ve experienced, and I can’t imagine any alternative could be as fulfilling.
My tribe of energy investors and golf club members is not representative of the general population. Nor is the subset of retirees who have enjoyed professional success to reach that stage. But they have more in common with the readers of this blog, and by extension to many of our clients.
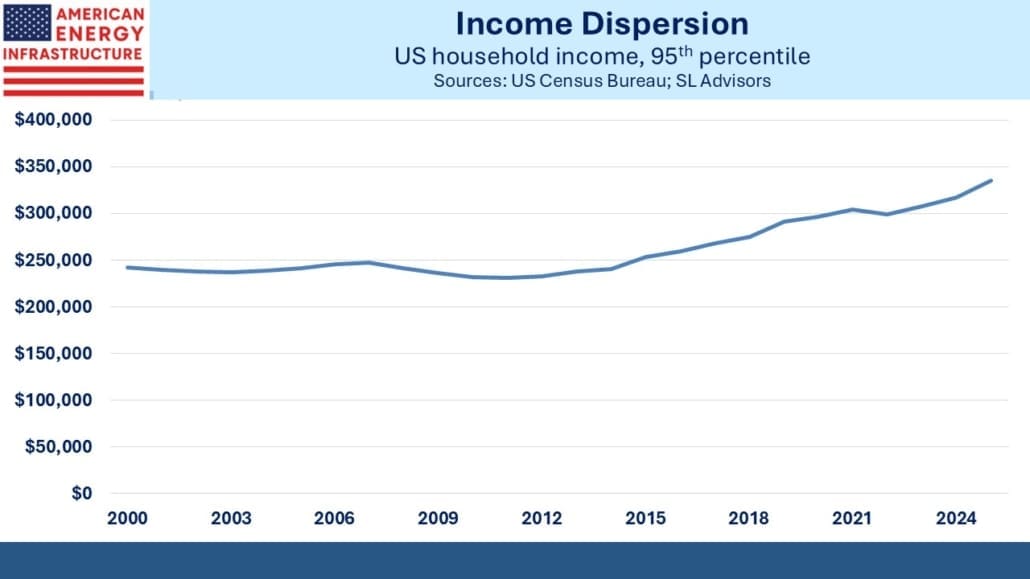
According to the Census Bureau, a male in his early 60s has on average twenty years of life remaining and a one in four chance of reaching 90. But longevity is correlated with income. Wealthier people enjoy better health and make better life choices. $336K in annual household income gets you into the top 5% of households and adds another five years of life expectancy.
Here begins the bet on how one’s income will grow compared with inflation. The 95th percentile of household net worth is $3.8 million according to the Federal Reserve’s Survey of Consumer Finances. A household at the 95th percentile of net worth and income is earning (and presumably spending) around a tenth of this annually. Even assuming a 3% after tax return, that retirement pot will shrink over time. To paraphrase Mr. Micawber in Dickens’ David Copperfield, the difference between outliving your savings and not is the difference between happiness and misery.
The spread between the rate at which your spending outgrows the income from your retirement assets will heavily impact the odds of later financial happiness. Over a quarter century, as little as a 1% adverse spread will leave you with 22% less purchasing power. A 3% spread will cut your purchasing power in half.
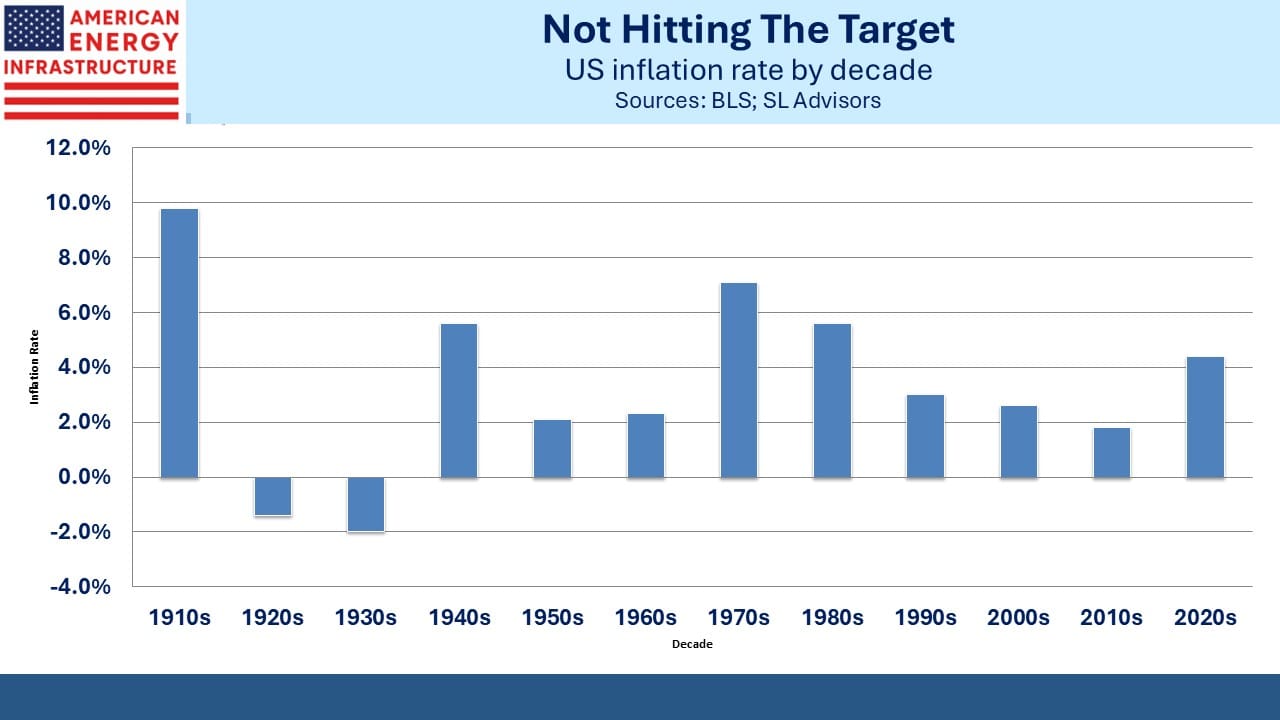
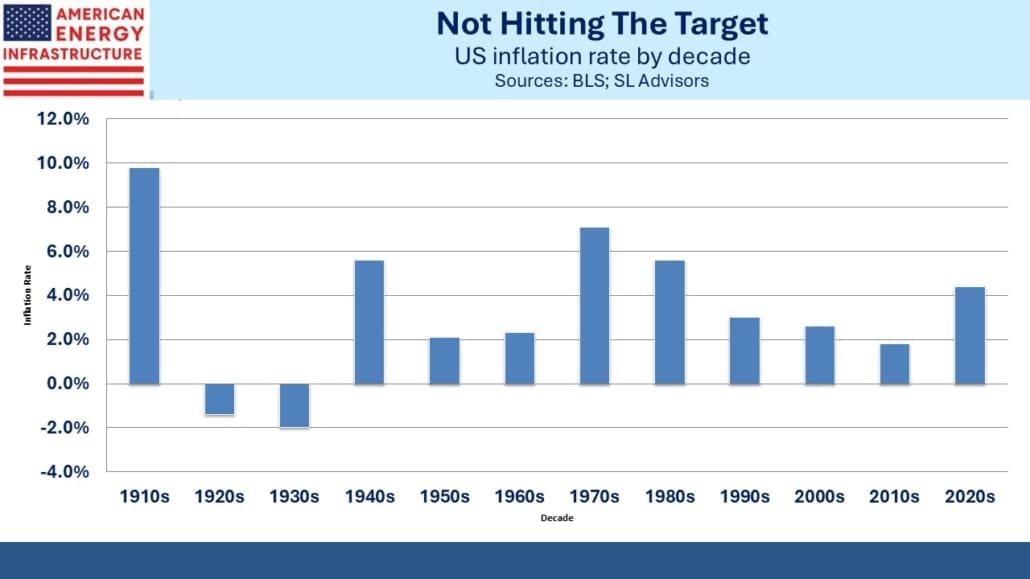
The case for assuming 2% inflation is extraordinarily weak. Since World War II, inflation has averaged 3.5% and has rarely been below 2%. Fiscal profligacy such as ours has for centuries ultimately been resolved through debt monetization and currency debasement, a regular theme of this blog (see US Explores The Limits On Spending).
Politicians long ago quit recommending fiscal solutions. Tax hikes and spending cuts quickly turn a legislator into a paid lobbyist after a lost election. It is democratic if unwise.
And even his biggest fans must concede that President Trump is not a hard money man. If the FOMC raises rates by the end of the year as is currently priced in to the futures market, the White House response will be voluble and bombastic.
The Democrats caused the biggest inflation surge in fifty years with the uber-stimulus in their comically named Inflation Reduction Act.
Neither party is credible on maintaining stable prices.
Inflation has been above 3% for the past five years. It’s an especially poor measure of how much spending has increased for the top 5%. Inflation statistics intentionally adjust for better products and services (known as hedonic quality adjustments). The CPI and its cousins only set out to measure the cost increase of a basket of goods and services of constant utility, matching which will leave your living standard slipping against your peers (see Economists Having Fun With Inflation).
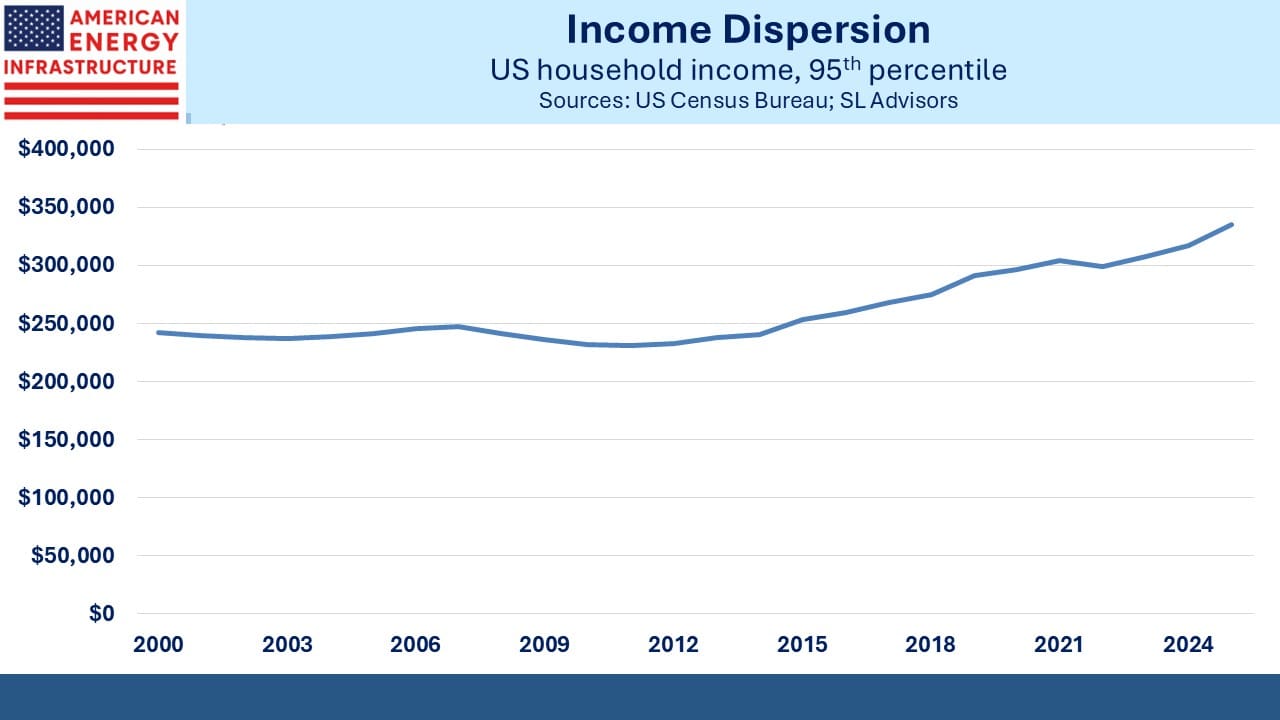
Moreover, the top 5% consume a basket of goods and services quite different from the average household. Surveys and Bureau of Labor Statistics data show that over the past five years the cost of fine dining, business class flights and live entertainment have all grown at around 6-8% per annum. Because, dear reader, you are fortunate to be richer than the typical American, your inflation rate is not close to what the government says it is.
What should our atypical retiree assume for her annual increase in living expenses?
2% seems ruinously optimistic, a level we’ve rarely hit and at odds with our fiscal outlook in spite of Fed Chair Kevin Warsh’s stated determination to retain it as the Fed’s goal.
4% is the average since 2021, but if the rest of the decade is similar, this still leaves our retiree steadily losing purchasing power.
5% is probably the lowest assumed inflation rate for someone in the top 5% of household income that wants to avoid feeling steadily poorer every year. 95th percentile household income has accelerated in recent years, growing at 2.9% over the past decade and 5.7% last year. Assuming a constant savings rate implies that the basket of goods and services consumed by that cohort has risen at the same rate.
Regular readers know that these blog posts guide to the buying opportunity that is midstream energy infrastructure. There are few asset classes that can match a 5% annual increase in living expenses. But a 4% dividend yield combined with a 3-4% dividend growth rate offers a decent chance of providing a commensurate after-tax return, unless you live in one of those blue, high tax states.
—
Originally Posted September 13, 2026 – Estimating Your Retirement Spending
Please go to following link for important legal disclosures: https://sl-advisors.com/legal-disclosure
SL Advisors is invested in all the components of the American Energy Independence Index via the ETF that seeks to track its performance.
Information posted on IBKR Campus that is provided by third-parties does NOT constitute a recommendation that you should contract for the services of that third party. Third-party participants who contribute to IBKR Campus are independent of Interactive Brokers and Interactive Brokers does not make any representations or warranties concerning the services offered, their past or future performance, or the accuracy of the information provided by the third party. Past performance is no guarantee of future results.
This material is from SL Advisors and is being posted with its permission. The views expressed in this material are solely those of the author and/or SL Advisors and Interactive Brokers is not endorsing or recommending any investment or trading discussed in the material. This material is not and should not be construed as an offer to buy or sell any security. It should not be construed as research or investment advice or a recommendation to buy, sell or hold any security or commodity. This material does not and is not intended to take into account the particular financial conditions, investment objectives or requirements of individual customers. Before acting on this material, you should consider whether it is suitable for your particular circumstances and, as necessary, seek professional advice.
Related Articles


















Join The Conversation
For specific platform feedback and suggestions, please submit it directly to our team using these instructions.
If you have an account-specific question or concern, please reach out to Client Services.
We encourage you to look through our FAQs before posting. Your question may already be covered!