
- Solve real problems with our hands-on interface
- Progress from basic puts and calls to advanced strategies
Interactive Options Course

Posted March 4, 2026 at 10:15 am
You may not be aware, but after a strong early-year performance, March often acts as a pause point for the US S&P 500 equity market.
The chart below shows that over the last 15 years, the S&P 500 has produced an average return of -0.09% during March, with an annualized return of -1.06%. While the winning percentage stands at 66.67%, the overall pattern is flat-to-soft, with cumulative performance showing a clear tendency to stall rather than extend higher.
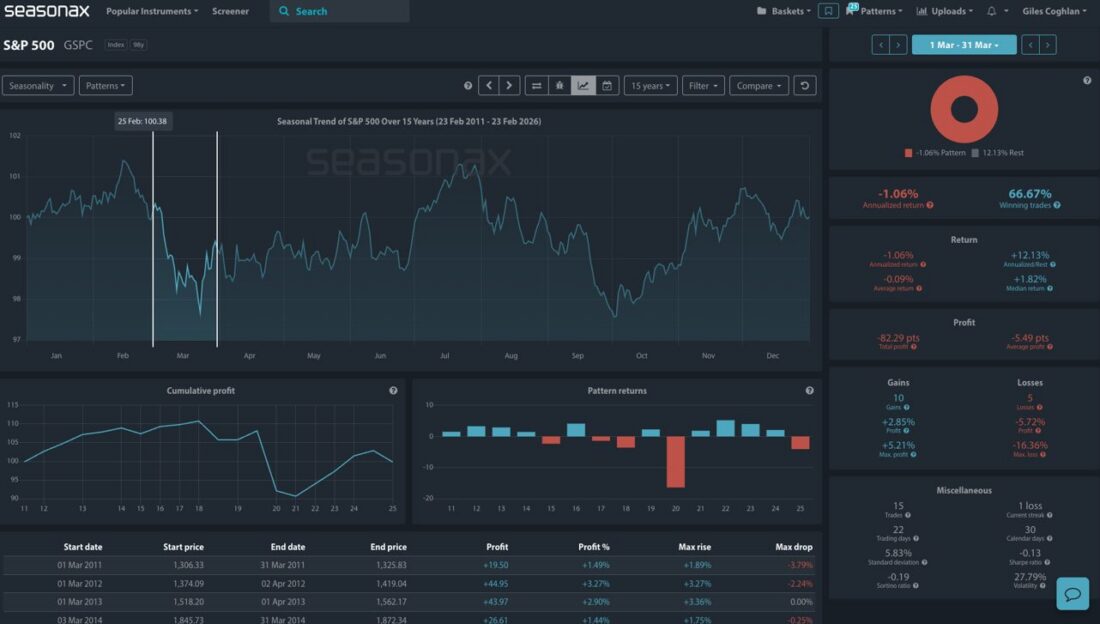
The analyzed period shows that March has historically acted as a pause month for the S&P 500, with flat to soft returns over the past 15 years. Source: Seasonax
In other words: March has historically been a month for consolidation and not strong upside continuation.
Looking at the broader monthly distribution over the past 15 years, March ranks among the weaker months for the S&P 500.
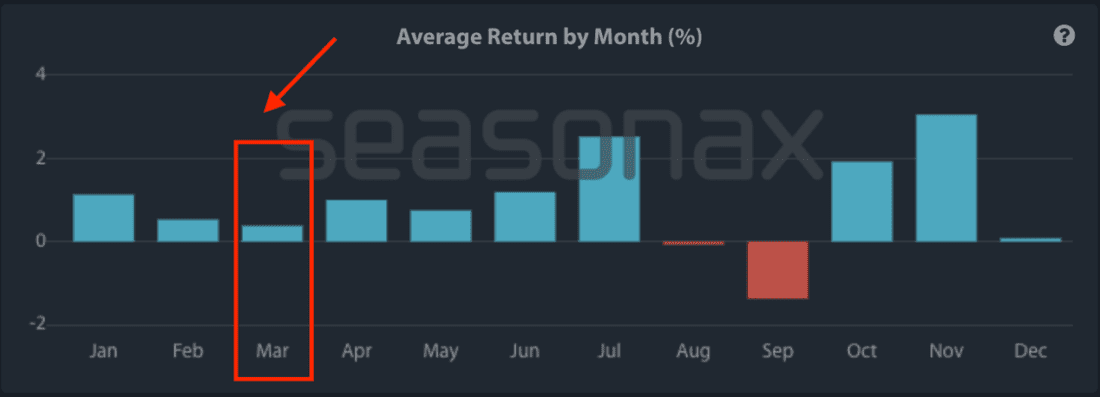
The monthly performance highlights that March tends to sit among the weaker seasonal periods for US equities. Source: Seasonax
This is because several dynamics tend to converge:
The cumulative profit curve for March below highlights this hesitation clearly – gains are often made early in the month (left-hand side of the chart below) before volatility picks up mid-to-late March.
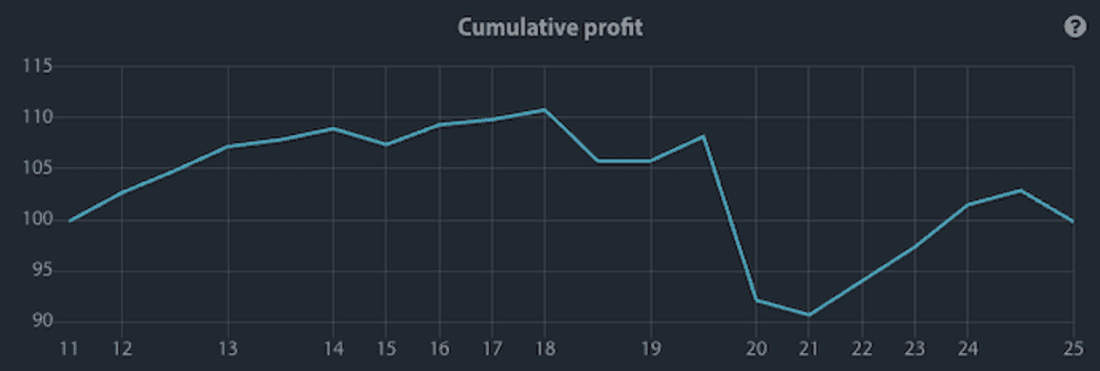
The cumulative March profit curve shows how early gains often fade as volatility rises later in the month. Source: Seasonax
In fact, the pattern return distribution shows several negative outliers, including sharp downside moves around the 20th trading day of the month – a reminder that volatility can expand quickly even in otherwise constructive years. The period between March 16 and March 23 over the last 15 years is highlighted in the chart below. There has been an average fall of 0.50%.

Highlighting the return distribution in March, including negative outliers and increased volatility in the mid-to-late part of the month. Source: Seasonax
March, historically, is less about trend extension and more about consolidation.
Importantly, this March softness sits within a much stronger seasonal backdrop immediately ahead.
The chart below shows that the dynamic changes from 1 April to 30 June where, over the last 15 years, the S&P 500 has delivered the following:
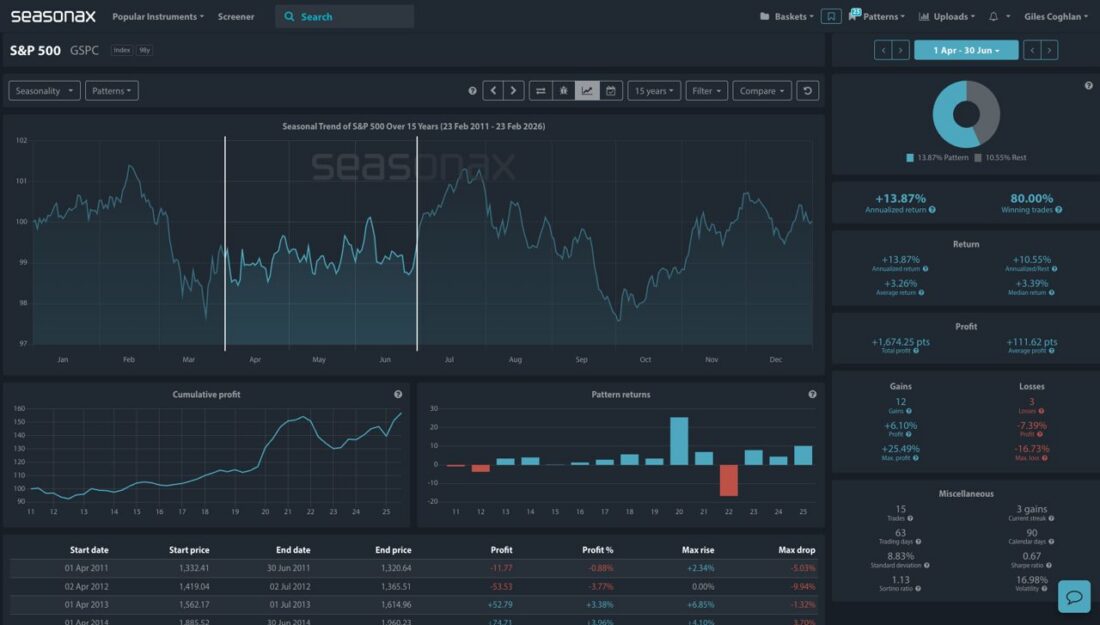
The April to June seasonal chart shows a clear shift toward stronger and more consistent returns following March consolidation. Source: Seasonax
In contrast, the cumulative Q2 profit curve rises steadily for Q2, reflecting a consistent seasonal tailwind into late spring.
In short:
Several macro factors reinforce the seasonal setup:
These factors can help explain why March often feels volatile and directionless, while April tends to regain momentum.
March should not necessarily be viewed as bearish, but seasonality shows it has historically been less reliable for upside extension compared with Q2.
Traders may consider the potential for the following:
If history is any guide, early-year strength does not typically accelerate in March, it pauses. However, once April begins, the seasonal odds shift decisively back in favor of the bulls.
Use Seasonax for your professional handling of market-moving events.
—
Originally Posted on March 3, 2026 – March Volatility: Why the S&P 500 Often Stalls After Early Year Gains
Past results and past seasonal patterns are no indication of future performance, in particular, future market trends. Seasonax GmbH neither recommends nor approves of any particular financial instrument, group of securities, segment of industry, analysis interval or any particular idea, approach, strategy or attitude nor provides consulting nor brokerage nor asset management services. Seasonax GmbH hereby excludes any explicit or implied trading recommendation, in particular, any promise, implication or guarantee that profits are earned and losses excluded, provided, however, that in case of doubt, these terms shall be interpreted in abroad sense. Any information provided by Seasonax GmbH or on this website or any other kind of data media shall not be construed as any kind of guarantee, warranty or representation, in particular as set forth in a prospectus. Any user is solely responsible for the results or the trading strategy that is created, developed or applied. Indicators, trading strategies and functions provided by seasonax GmbH or on this website or any other kind of data media may contain logical or other errors leading to unexpected results, faulty trading signals and/or substantial losses. Seasonax GmbH neither warrants nor guarantees the accuracy, completeness, quality, adequacy or content of the information provided by it or on this website or any other kind of data media. Any user is obligated to comply with any applicable capital market rules of the applicable jurisdiction. All published content and images on this website or any other kind of data media are protected by copyright. Any duplication, processing, distribution or any form of utilisation beyond the scope of copyright law shall require the prior written consent of the author or authors in question. Futures and forex trading contains substantial risk and is not for every investor. An investor could potentially lose all or more than the initial investment. Risk capital is money that can be lost without jeopardizing ones’ financial security or lifestyle. Only risk capital should be used for trading and only those with sufficient risk capital should consider trading. Past performance is not necessarily indicative of future results. Testimonials appearing on this website may not be representative of other clients or customers and is not a guarantee of future performance or success.
Information posted on IBKR Campus that is provided by third-parties does NOT constitute a recommendation that you should contract for the services of that third party. Third-party participants who contribute to IBKR Campus are independent of Interactive Brokers and Interactive Brokers does not make any representations or warranties concerning the services offered, their past or future performance, or the accuracy of the information provided by the third party. Past performance is no guarantee of future results.
This material is from Seasonax and is being posted with its permission. The views expressed in this material are solely those of the author and/or Seasonax and Interactive Brokers is not endorsing or recommending any investment or trading discussed in the material. This material is not and should not be construed as an offer to buy or sell any security. It should not be construed as research or investment advice or a recommendation to buy, sell or hold any security or commodity. This material does not and is not intended to take into account the particular financial conditions, investment objectives or requirements of individual customers. Before acting on this material, you should consider whether it is suitable for your particular circumstances and, as necessary, seek professional advice.
Related Articles


Join The Conversation
For specific platform feedback and suggestions, please submit it directly to our team using these instructions.
If you have an account-specific question or concern, please reach out to Client Services.
We encourage you to look through our FAQs before posting. Your question may already be covered!