
- Solve real problems with our hands-on interface
- Progress from basic puts and calls to advanced strategies
Interactive Options Course

Posted February 24, 2026 at 1:17 pm
In advance of this evening’s Presidential State of the Union address, it seemed relevant to offer my own “State of the Markets” piece. I would define the current state of the markets as generally solid but with some developing fault lines under the relatively placid surface.
The current bull market began in November 2022, nearly 3 ½ years ago, and it is no coincidence that ChatGPT was launched that month. Enthusiasm for artificial intelligence has been a key factor in driving markets higher ever since. Most stocks have done well during the current run, but the leadership has been driven by stocks that were perceived as beneficiaries of the new technology: semiconductor manufacturers like Nvidia (NVDA), Broadcom (AVGO), and AMD; hyperscalers like Alphabet (GOOGL, GOOG), Microsoft (MSFT), Meta Platforms (META), and Amazon (AMZN); and related plays like utilities and the manufacturers who build the equipment that powers them, like GE Vernova (GEV).
The run has been long and relatively uninterrupted. The only significant pullback occurred after the “Liberation Day” tariffs were announced in April. They were certainly a negative surprise. Investors greeted the new administration eagerly, with expectations for tax cuts and deregulation among the anticipated events. While those eventually occurred to varying extents, tariffs – particularly when they seemed haphazard and punitive – were not on investors’ agenda. Then, when the President seemed to dig in even as markets turned “yippy,” markets were stunned to see him failing to display the market friendliness that characterized his first term. Only after he reversed course did stocks resume their advance, despite the ongoing presence of tariffs.
The April selloff and recovery highlighted a key element of investor behavior. Individual investors saw that swoon as temporary and took advantage of the lower prices to purchase their favorite stocks at a discount. “Buy the dip” has been a key factor in sustaining the current bull market, not to mention much of the rise that has occurred for over a decade. We have noted that dip buying is an age-old strategy. It would not surprise me if there was a Sumerian text about someone making a profit after buying wheat or barley during a temporary drop in those commodity prices. Since 2020, however, dip-buying has become embraced by the public in a manner that is unprecedented by recent standards. As long as faith in that strategy persists, stocks can remain well-supported.
Lately, as we reach the median age for a secular bull market, we have been noting a major change in investor attitudes. For more than three years, the prevailing attitude was “How can AI improve the bottom lines of my stock holdings?” Now that has changed to “How might AI negatively disrupt and impair those companies’ businesses?” Just yesterday, we saw an apocalyptic report injure the prices of software and financial stocks, then in the afternoon we saw IBM drop 13% after Anthropic announced an AI tool for COBOL that runs on the giant’s mainframes.
But that mindset has its limitations. We saw dip buying among our most active customers yesterday – not to the extent that we saw during last April’s declines, but noticeable nonetheless – and today we see stocks like Thomson Reuters (TRI) and Intuit (INTU) moving higher after announcing partnerships with Anthropic.
Another thing to note is that index volatility is relatively tame. The 30-day historical volatility of the S&P 500 (SPX) has lifted from the lows that prevailed at the start of this year and much of last year’s third quarter, but it remains below even the modest bounce in volatility that we saw in November – let alone April’s chaos.
1-Year, SPX 30-Day Historical Volatility (orange, right scale), Implied Volatility (white, right scale), Index Level (faint grey, left scale)
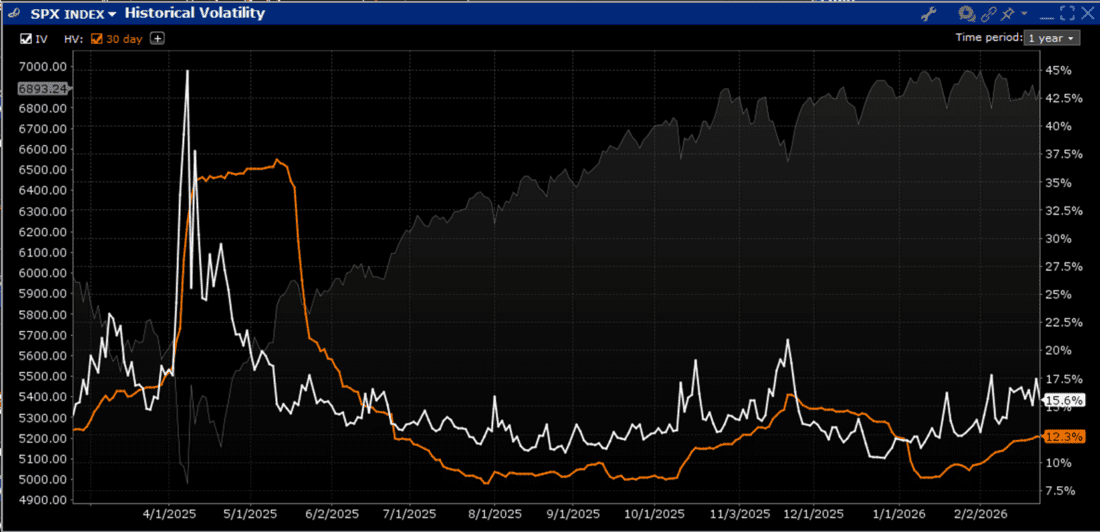
Source: Interactive Brokers
Index volatility tends to rise when correlations rise, and we have seen the COR1M Index climb off its lows as SPX historical volatility rose. But it is interesting to note that dispersion, as measured by DSPX, has also risen. Dispersion and correlation are often viewed as being flip sides of the same coin, and while that is not always the case, it is a reasonable construct most of the time. Instead, we see both rising along with VIX.
10-Months, COR1M (red/white/green daily candles), VIX (blue line), DSPX (purple line)
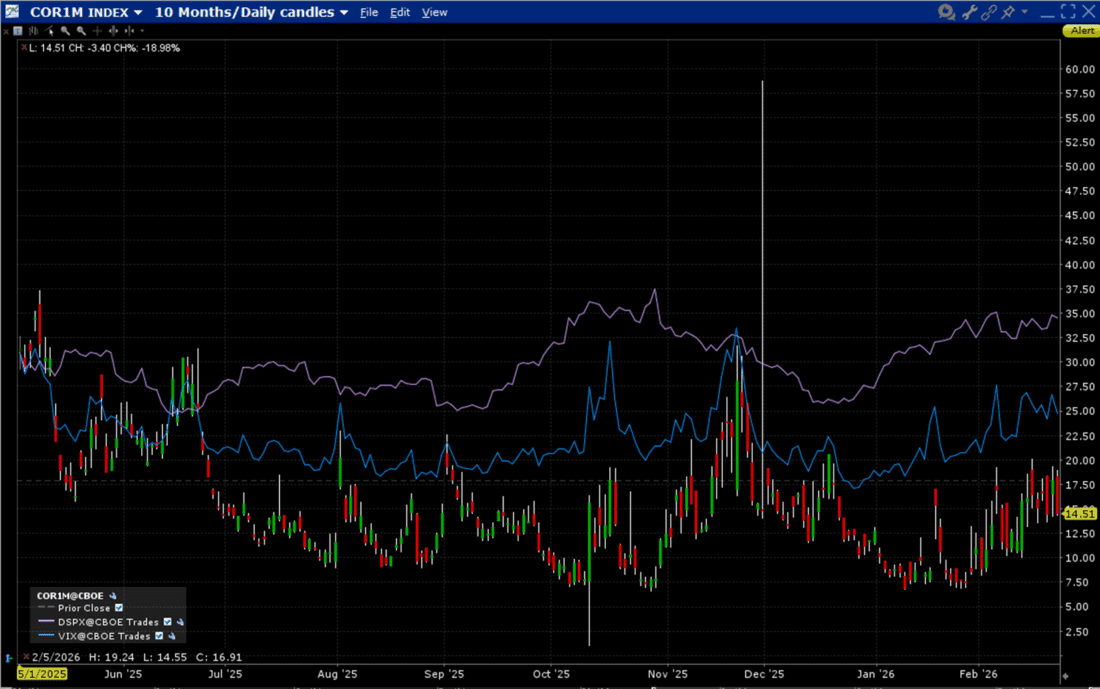
Source: Interactive Brokers
This means that we find the state of the markets at an interesting crossroads. Market volatility is flat, but individual stocks are diverging at a high rate, abetted by occasional AI-induced potholes. Market psychology is less robust than we have seen throughout most of the past few years, but we remain bolstered by individuals’ continual willingness to see dips as buying opportunities. On a short-term basis we seem constrained by the 50- and 100-day moving averages, with the 50-day now offering resistance, and more broadly in a 6800-7000 trading range. On a longer-term basis, with the exception of the tariff tantrum period those moving averages have defined the prevailing uptrend for at least two years. When the 50-day failed to provide support, the 100-day did.
Bottom line, the short-term state of the markets is in flux. A continuation of the rally will require a bump above (first) the 50-day moving average, then another convincingly above the 7000 level. A move below the 100-day moving average, particularly if it takes the index convincingly below the 6800 or 6750 levels, could lead us to see a period of retrenchment. The relatively quiescent volatility would likely take a big leap higher if that came to pass.
SPX 3-Months, Daily Candles, with 50-Day (blue) and 100-Day (purple) Moving Averages
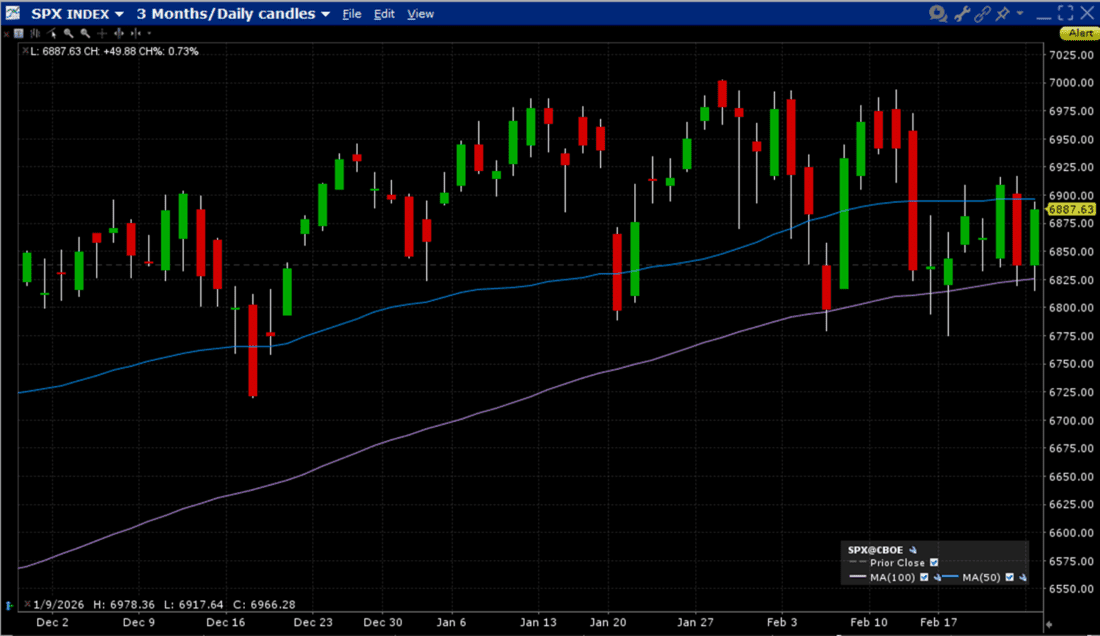
Source: Interactive Brokers
SPX 2-Years, Daily Candles, with 50-Day (blue) and 100-Day (purple) Moving Averages
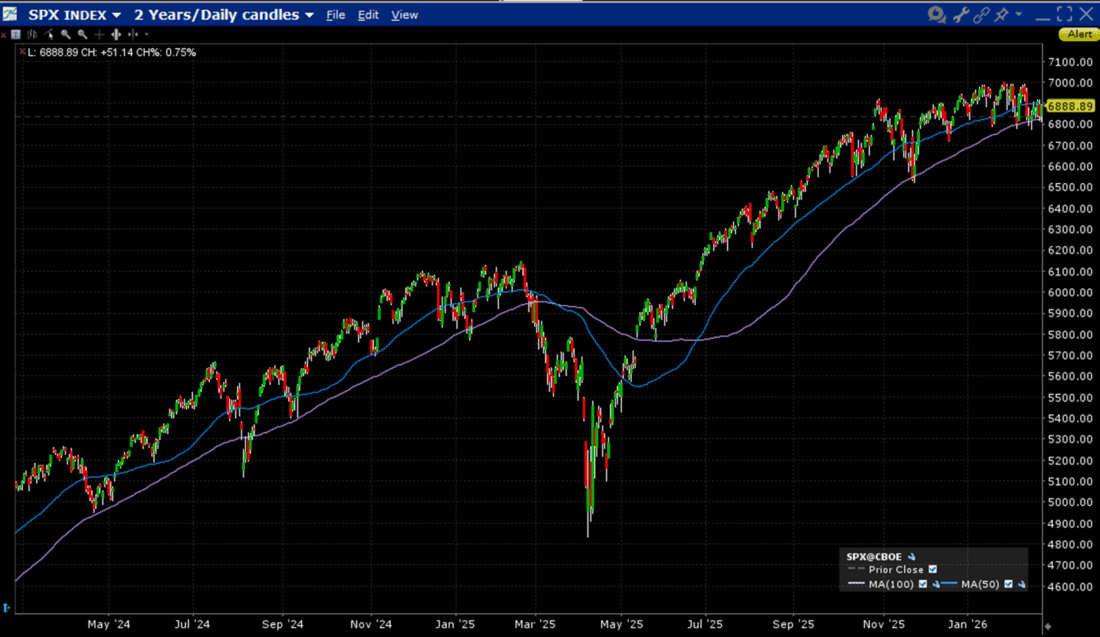
Source: Interactive Brokers
For specific platform feedback and suggestions, please submit it directly to our team using these instructions.
If you have an account-specific question or concern, please reach out to Client Services.
We encourage you to look through our FAQs before posting. Your question may already be covered!
The analysis in this material is provided for information only and is not and should not be construed as an offer to sell or the solicitation of an offer to buy any security. To the extent that this material discusses general market activity, industry or sector trends or other broad-based economic or political conditions, it should not be construed as research or investment advice. To the extent that it includes references to specific securities, commodities, currencies, or other instruments, those references do not constitute a recommendation by IBKR to buy, sell or hold such investments. This material does not and is not intended to take into account the particular financial conditions, investment objectives or requirements of individual customers. Before acting on this material, you should consider whether it is suitable for your particular circumstances and, as necessary, seek professional advice.
The views and opinions expressed herein are those of the author and do not necessarily reflect the views of Interactive Brokers, its affiliates, or its employees.


It was a good day for getting your money out, and at semi-decent price points. Everyone loves a nice short squeeze, right? Even if it doesn’t last. Can we get another knee-jerk reaction like last Friday? Or. even something else to bet on? Something that will create even more 1 day wonders?