
- Solve real problems with our hands-on interface
- Progress from basic puts and calls to advanced strategies
Interactive Options Course

Posted February 24, 2026 at 10:15 am
Three shifts: rotation from Tech to old economy sectors; AI driven dispersion in Tech; and higher risk from Tech concentration are underscoring the value of diversification.
Markets move quickly, and that can blur investor’s vision. So, let’s zoom out a bit and try to see the bigger picture.
There’s no shortage of commentary on the Technology sector, particularly around what artificial intelligence (AI) means for the largest hyperscaler names. But today’s market dynamics extend well beyond a handful of glamour stocks or forecasts of AI’s productivity promise.
Below are three big picture takeaways from recent market trends—insights that extend beyond hyperscalers, valuation multiples, and AI growth forecasts to help inform more resilient portfolio positioning.
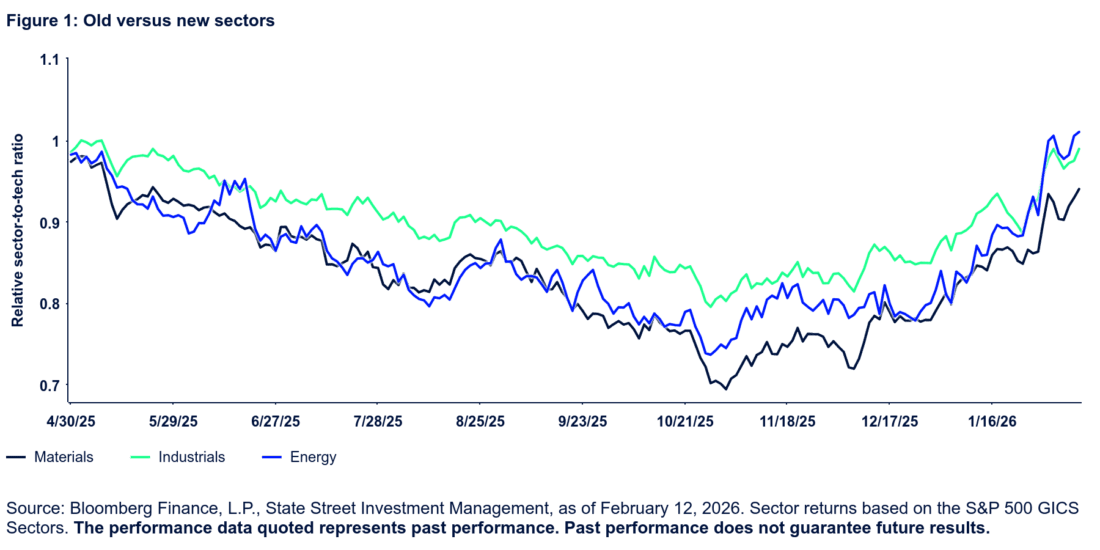
The old economy is cool again. In recent months, old economy and manufacturing and asset heavy sectors have rebounded relative to new economy sectors like Technology.
Since the end of October 2025, Industrials, Materials, and Energy have outperformed the Tech sector by more than 20%, 31%, and 32%, respectively (Figure 1).1 On a trailing three-month basis, Energy’s 24% outperformance versus Tech sector ranks in the 93rd percentile over the past 35 years.2
Importantly, this rotation is not purely cyclical. It reflects a combination of fundamental and macroeconomic forces—some of which are increasingly structural.
On the fundamental side, concerns around exuberant capital spending and rising debt issuance have weighed on headline Tech sentiment, despite strong earnings results. At the same time, many old economy sectors have delivered solid earnings so far this season. Industrials and Materials companies are posting double-digit bottom line growth, while Energy’s earnings have come in better than expected at the start of the year.3
From a macro perspective, easy monetary policy has supported growth and, in turn, cyclical market segments, with Industrials being a prime beneficiary. Fiscal spending initiative, especially in defense, have provided additional tailwinds, There is also a more structural shift: the rewiring of global trade and supply chains. These changes have put upward pressure on commodity prices, benefiting natural resource sensitive sectors like Energy and Materials.
Key takeaway: This shift in market leadership may have seemed unfathomable to many investors in 2024 and 2025, when the prevailing narrative was “tech or bust.” It’s a reminder of how difficult it is to predict the future, how quickly winners and losers can change, and how challenging it is for any sector to remain on top indefinitely. It also reflects growing investor impatience with the timeline for returns on the massive wave of AI related spending.
Identifying the ultimate winners and losers of AI remains extraordinarily difficult—not just among AI leaders themselves, but across the broader economy.
The recent bear market drawdown in the software industry—down roughly 20% in 2026 following the release of Anthropic’s Claude Code and Claude Cowork—underscores this uncertainty.4 Notably, this disruption occurred in an industry in the Technology sector, highlighting how AI can have the potential to disrupt even peer-like firms.
Ambiguity over eventual AI leadership and software’s drawdown have produced a market dynamic rarely seen outside of major inflection points. Return dispersion across the 11 Technology sub industries has surged to extreme levels, reaching the 92nd percentile historically (Figure 2).
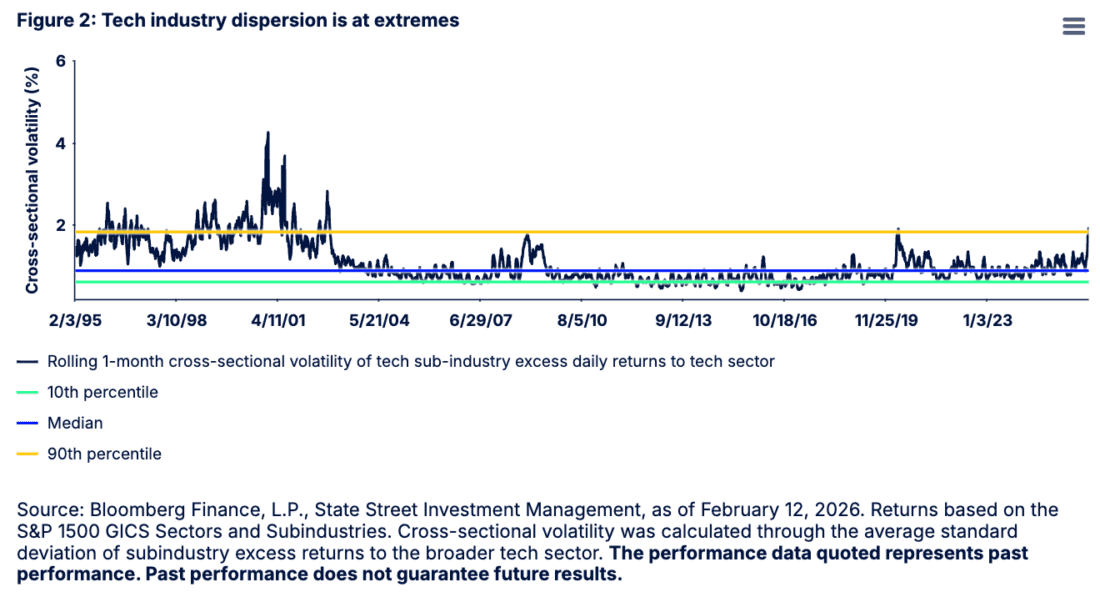
This level of dispersion has occurred only during the COVID-19 pandemic, the Great Financial Crisis, and the dot-com bubble. Three major memorable market events that have historically coincided with broad market meltdowns. But, today, the market is up, making this level of dispersion extremely noteworthy.
In hindsight, this period will be viewed as the point at which a structural divide emerged within the Technology sector—driven not by external forces, but by innovation originating in the sector itself. As AI reshapes competitive dynamics, Technology appears to be fragmenting into firms that are successfully translating AI investment into sustainable growth and those that are not.
Key takeaway: Elevated dispersion serves as a reminder that sector membership alone does not guarantee uniform performance. Even if sectors share similar macroeconomic and fundamental exposures, outcomes can vary meaningfully. For investors, this creates opportunities to harness dispersion through targeted industry selection within sectors.
The challenge with a self inflicted setback within the Technology sector is that, due to its outsized weight in broad equity benchmarks, many investors may be more exposed to this risk than they realize. Technology’s share of both US and global equity markets sits at generational highs—at a time when US households also hold record levels of corporate equity exposure. This concentration stands in contrast to the notion of a broadly diversified investor base (Figure 3).

This level of ownership hasn’t proved problematic; US equity markets have had double-digit annual returns in six out of the last seven years.5 Yet household wealth remains more sensitive to market fluctuations than any other point in recent history.
This Goldilocks-like positioning extends beyond household wealth. Seventy percent of all ETF and mutual fund assets are invested in equities—namely US equities.6 Our State Street Institutional investor holdings indicator for equity allocations is at its highest point since 20077 and levered investors have rebuilt positions from mid-2026 and are currently extended as well.8
With all this wealth invested in the market, any drawdown—particularly Technology led weakness, given the sector’s disproportionate contribution to overall returns—has the potential to create cascading effects. These may include pressures on consumer spending, labor formation, and aggregate economic growth. The resulting policy response is also uncertain: low interest rates or fiscal stimulus could provide short term relief, but at the cost of worsening fiscal imbalances. In that context, weakness in Technology may represent not an isolated event, but the first domino.
Key takeaway: What may appear to be isolated weakness within Technology could translate into broader portfolio pressures, given the sector’s outsized role in market returns. That risk can be mitigated by reassessing asset allocations and seeking greater diversification and balance across assets, geographies, and economic environments. As with sectors, no single asset class remains dominant indefinitely.
The throughline of these takeaways is that we are investing during a period of profound transition and transformation—marked by seismic changes in macroeconomic frameworks, a move from international cooperation toward greater isolation, and technological innovations with still unknown social and economic impacts.
With this level of uncertainty on the horizon, forecasting future winners feels like looking into a car’s side-view mirror and seeing things as all clear—without recognizing the blind spots just outside the frame. In that context, balanced diversification remains the most reliable safeguard: a way to broaden perspective, manage uncertainty, and navigate what lies ahead with greater confidence.
—
Originally Posted on February 18, 2026 – Three shifts reshaping Technology—and portfolios
For specific platform feedback and suggestions, please submit it directly to our team using these instructions.
If you have an account-specific question or concern, please reach out to Client Services.
We encourage you to look through our FAQs before posting. Your question may already be covered!
Do not reproduce or reprint without the written permission of SSGA.
All information has been obtained from sources believed to be reliable, but its accuracy is not guaranteed. There is no representation or warranty as to the current accuracy, reliability or completeness of, nor liability for, decisions based on such information and it should not be relied on as such.
State Street Global Advisors and its affiliates (“SSGA”) have not taken into consideration the circumstances of any particular investor in producing this material and are not making an investment recommendation or acting in fiduciary capacity in connection with the provision of the information contained herein.
ETFs trade like stocks, are subject to investment risk, fluctuate in market value and may trade at prices above or below the ETF’s net asset value. Brokerage commissions and ETF expenses will reduce returns.
Bonds generally present less short-term risk and volatility than stocks, but contain interest rate risk (as interest rates raise, bond prices usually fall); issuer default risk; issuer credit risk; liquidity risk; and inflation risk. These effects are usually pronounced for longer-term securities. Any fixed income security sold or redeemed prior to maturity may be subject to a substantial gain or loss.
Investing involves risk including the risk of loss of principal.
The whole or any part of this work may not be reproduced, copied or transmitted or any of its contents disclosed to third parties without SSGA’s express written consent.
Investing in high yield fixed income securities, otherwise known as “junk bonds”, is considered speculative and involves greater risk of loss of principal and interest than investing in investment grade fixed income securities. These Lower-quality debt securities involve greater risk of default or price changes due to potential changes in the credit quality of the issuer.
COPYRIGHT AND OTHER RIGHTS
Other third party content is the intellectual property of the respective third party and all rights are reserved to them. All rights reserved. No organization or individual is permitted to reproduce, distribute or otherwise use the statistics and information in this report without the written agreement of the copyright owners.
Definition:
Arbitrage: the simultaneous buying and selling of securities, currency, or commodities in different markets or in derivative forms in order to take advantage of differing prices for the same asset.
Fund Objectives:
SPY: The investment seeks to provide investment results that, before expenses, correspond generally to the price and yield performance of the S&P 500® Index. The Trust seeks to achieve its investment objective by holding a portfolio of the common stocks that are included in the index (the “Portfolio”), with the weight of each stock in the Portfolio substantially corresponding to the weight of such stock in the index.
VOO: The investment seeks to track the performance of a benchmark index that measures the investment return of large-capitalization stocks. The fund employs an indexing investment approach designed to track the performance of the Standard & Poor’s 500 Index, a widely recognized benchmark of U.S. stock market performance that is dominated by the stocks of large U.S. companies. The advisor attempts to replicate the target index by investing all, or substantially all, of its assets in the stocks that make up the index, holding each stock in approximately the same proportion as its weighting in the index.
IVV: The investment seeks to track the investment results of the S&P 500 (the “underlying index”), which measures the performance of the large-capitalization sector of the U.S. equity market. The fund generally invests at least 90% of its assets in securities of the underlying index and in depositary receipts representing securities of the underlying index. It may invest the remainder of its assets in certain futures, options and swap contracts, cash and cash equivalents, as well as in securities not included in the underlying index, but which the advisor believes will help the fund track the underlying index.
The funds presented herein have different investment objectives, costs and expenses. Each fund is managed by a different investment firm, and the performance of each fund will necessarily depend on the ability of their respective managers to select portfolio investments. These differences, among others, may result in significant disparity in the funds’ portfolio assets and performance. For further information on the funds, please review their respective prospectuses.
Entity Disclosures:
The trademarks and service marks referenced herein are the property of their respective owners. Third party data providers make no warranties or representations of any kind relating to the accuracy, completeness or timeliness of the data and have no liability for damages of any kind relating to the use of such data.
SSGA Funds Management, Inc. serves as the investment advisor to the SPDR ETFs that are registered with the United States Securities and Exchange Commission under the Investment Company Act of 1940. SSGA Funds Management, Inc. is an affiliate of State Street Global Advisors Limited.
Intellectual Property Disclosures:
Standard & Poor’s®, S&P® and SPDR® are registered trademarks of Standard & Poor’s® Financial Services LLC (S&P); Dow Jones is a registered trademark of Dow Jones Trademark Holdings LLC (Dow Jones); and these trademarks have been licensed for use by S&P Dow Jones Indices LLC (SPDJI) and sublicensed for certain purposes by State Street Corporation. State Street Corporation’s financial products are not sponsored, endorsed, sold or promoted by SPDJI, Dow Jones, S&P, their respective affiliates and third party licensors and none of such parties make any representation regarding the advisability of investing in such product(s) nor do they have any liability in relation thereto, including for any errors, omissions, or interruptions of any index.
BLOOMBERG®, a trademark and service mark of Bloomberg Finance, L.P. and its affiliates, and BARCLAYS®, a trademark and service mark of Barclays Bank Plc., have each been licensed for use in connection with the listing and trading of the SPDR Bloomberg Barclays ETFs.
Distributor: State Street Global Advisors Funds Distributors, LLC, member FINRA, SIPC, an indirect wholly owned subsidiary of State Street Corporation. References to State Street may include State Street Corporation and its affiliates. Certain State Street affiliates provide services and receive fees from the SPDR ETFs.
ALPS Distributors, Inc., member FINRA, is distributor for SPDR® S&P 500®, SPDR® S&P MidCap 400® and SPDR® Dow Jones Industrial Average, all unit investment trusts. ALPS Distributors, Inc. is not affiliated with State Street Global Advisors Funds Distributors, LLC.
Before investing, consider the funds’ investment objectives, risks, charges, and expenses. For SPDR funds, you may obtain a prospectus or summary prospectus containing this and other information by calling 1‐866‐787‐2257 or visiting www.spdrs.com. Please read the prospectus carefully before investing.
Information posted on IBKR Campus that is provided by third-parties does NOT constitute a recommendation that you should contract for the services of that third party. Third-party participants who contribute to IBKR Campus are independent of Interactive Brokers and Interactive Brokers does not make any representations or warranties concerning the services offered, their past or future performance, or the accuracy of the information provided by the third party. Past performance is no guarantee of future results.
This material is from State Street Global Advisors and is being posted with its permission. The views expressed in this material are solely those of the author and/or State Street Global Advisors and Interactive Brokers is not endorsing or recommending any investment or trading discussed in the material. This material is not and should not be construed as an offer to buy or sell any security. It should not be construed as research or investment advice or a recommendation to buy, sell or hold any security or commodity. This material does not and is not intended to take into account the particular financial conditions, investment objectives or requirements of individual customers. Before acting on this material, you should consider whether it is suitable for your particular circumstances and, as necessary, seek professional advice.
Any discussion or mention of an ETF is not to be construed as recommendation, promotion or solicitation. All investors should review and consider associated investment risks, charges and expenses of the investment company or fund prior to investing. Before acting on this material, you should consider whether it is suitable for your particular circumstances and, as necessary, seek professional advice.
Mutual Funds are investments that pool the funds of investors to purchase a range of securities to meet specified objectives, such as growth, income or both. Investors are reminded to consider the various objectives, fees, and other risks associated with investing in Mutual Funds. Please read the prospectus accordingly. This communication is not to be construed as a recommendation, solicitation or promotion of any specific fund, or family of funds. Interactive Brokers may receive compensation from fund companies in connection with purchases and holdings of mutual fund shares. Such compensation is paid out of the funds' assets. However, IBKR does not solicit you to invest in specific funds and does not recommend specific funds or any other products to you. For additional information please visit https://www.interactivebrokers.com/en/index.php?f=1563&p=mf
Mutual Fund products are only available from Interactive Brokers for IBKR LLC, IBKR Hong Kong and IBKR Singapore entities.
Related Articles


Spot on analysis and observation. We should view fundamentals as a starting point for logical investing going forward