
- Solve real problems with our hands-on interface
- Progress from basic puts and calls to advanced strategies
Interactive Options Course

Posted February 17, 2026 at 1:09 pm
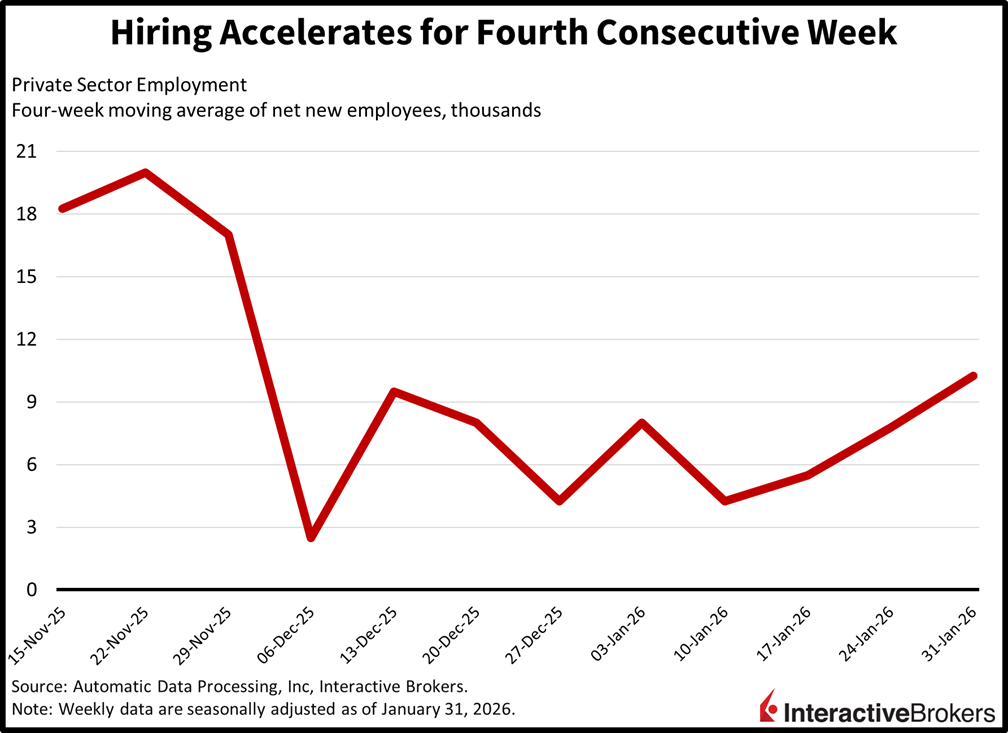
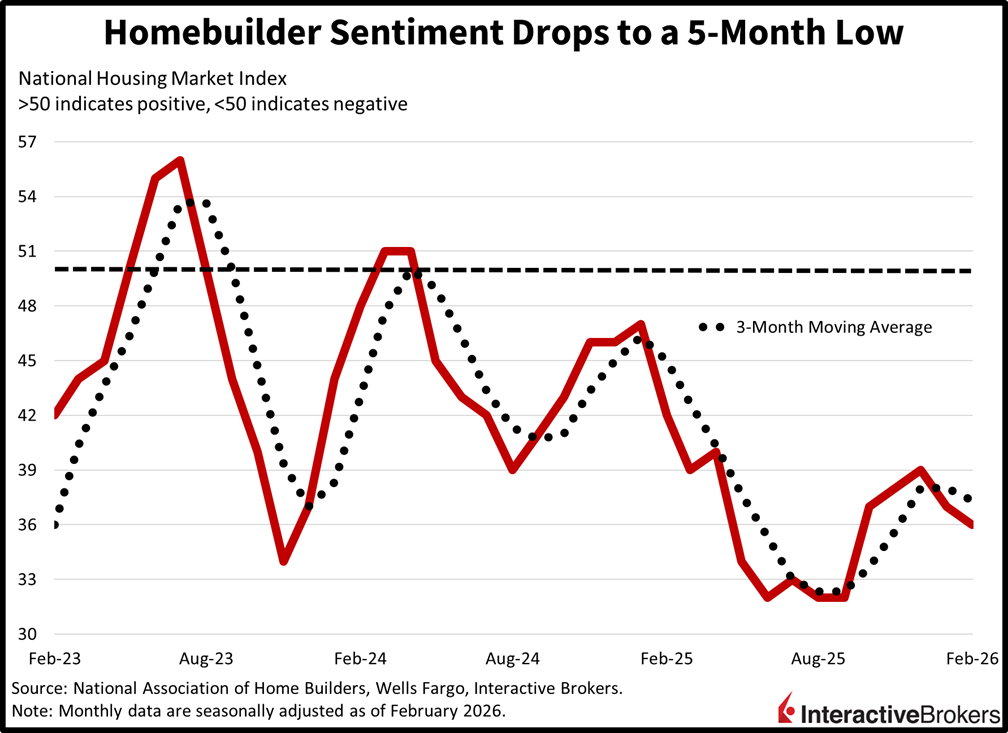
A volatile beginning to a holiday shortened trading week has featured stocks swinging from deep losses to modest gains as investors contend with the headwinds of dwindling AI optimism alongside the tailwinds of 68 basis points of rate cuts priced for 2026. Economic data supported the intraday buy the dip enthusiasm though, as ADP’s weekly hiring numbers posted the fourth consecutive acceleration, helping to quell unemployment concerns while lifting yields in the Treasury complex. The calendar was mixed overall, however, as homebuilder sentiment dived to a five-month low due to a dearth of prospective buyers even as mortgage rates have been sinking while valuation expansions decelerate, resulting in the indicator’s second decline in a row. Still, the curve is ascending in bear-flattening fashion led north by the short-end, as stronger labor figures narrow the path to imminent monetary policy accommodation. Those developments are also driving greenback appreciation amidst outperformance from the cyclical areas in the equity space, as financials, industrials and real estate lead the indies. Commodities and cryptocurrencies are getting creamed across the board, with silver, gold and bitcoin losing 5.9%, 3.8% and 2.2%. Elsewhere, hedging demand has weakened throughout the session in light of bullish orders on Wall Street and forecast contracts are catching bids.
Private sector payrolls increased by an average of 10.25k workers in each of the four weeks during the period ended Jan. 31, according to ADP. It was the fourth consecutive week of acceleration, picking up from the last three reported figures of 7.75k, 5.5k and 4.25k. The progress is quelling anxieties related to how rising unemployment could potentially upend the cycle.
Homebuilder sentiment isn’t responding positively to decelerating prices and lighter mortgage rates as firms continue to rely on incentives and concessions to drive transactions. Additionally, the headwind of immigration restriction and declining household formation as a result is lowering real estate demand in aggregate. The headline score of 36 was the weakest since October and beneath the median estimate of 38 and January’s 37. It also marked the second consecutive month of declines. Even as the sub-index representing the sales outlook for the present remained unchanged at 41, subtractions in the expectations for future closings and the traffic of prospective buyers sank from 49 and 24 to 46 and 22. Most regions reported deteriorating conditions with the Northeast, Midwest and West sliding from 47, 42 and 34 to 42, 41 and 30. The South was steady, however, at 35.
An eventful week on the economic data front can continue to bolster the cyclical areas of the market that are levered to robust activity and looser financial conditions. However, worries that the tech sector is overspending on AI in proportion to its expected returns is poised to weigh on the industry’s performance this year following three annums of spectacular gains. Societal expansions of substantial magnitudes hardly advance in a straight line, as constraints like energy capacity, competitive advantages, practicality in use and significant expenses pose challenges on the path towards superb profitability. Still, in aggregate, firms are augmenting top and bottom lines nicely, and it wouldn’t be a terrible thing for Wall Street to catch its breath and broaden out while the Magnificent Seven gets set for its next sprint in 2027.
Japan’s economy moved from contraction in the third quarter to marginal growth during the three months ended in December but underperformed expectations. The report of sluggish growth occurs as Prime Minister Sanae Takaichi is seeking to prime the economy by boosting spending. The Bank of Japan, however, has alluded to future rate increases to curtail inflation, although the report of weak economic expansion is likely to complicate that initiative.
On a quarter-over-quarter (q/q) basis, gross domestic product (GDP) expanded 0.1% following the 0.7% decline in the three-month period ended in September. Economists anticipated a 0.4% gain. Relative to the final three months of 2024, GDP was 0.2% higher, substantially missing the 1.6% economist consensus estimate after the 2.6% year-over-year (y/y) contraction in the third quarter. The GDP report included other disappointing metrics. Capital expenditures were up only 0.2% q/q. Economists predicted a 0.8% jump following the 0.3% drop in the preceding period. Private consumption, while meeting the economist consensus estimate for 0.1% q/q growth, eased from the last print’s 0.4% pace.
Japan’s capacity utilization was 1.3% higher in December than in the preceding month after slipping 5.3% month over month (m/m) in November. Meanwhile, industrial production sank 0.1% m/m, matching the economist consensus estimate and easing from the 2.7% drop in November.
Singapore’s trade surplus climbed from SGD 4.5 billion in December to SGD 12.53 billion last month, its highest level since April of last year.
In January, non-oil exports were up 0.7% m/m and 9.3% y/y following December’s m/m drop of 8.6% and y/y increase of 6.1%.
Industrial production in the euro area was down 1.4% m/m during December, a slightly slower decline than the 1.5% descent anticipated by a consensus of economists but a reversal from the 0.3% ascent in November. Despite the monthly decline, output was still up 1.2% y/y, which matched the economist consensus expectation. In the preceding period, industrial production was elevated by 2.2% y/y.
For the December m/m print the following categories and the extent of their declines pulled down the headline:
Durable consumer goods and non-durable consumer partially cushioned the drop, heading north by 0.2% and 0.3%.
Among some of the larger countries, production was lower by 2.9% in Germany and 2.6% in Spain while Luxembourg, Sweden and Malta experienced gains of 6.4%, 4.4% and 4.2%.
The number of working individuals in the UK descended by 121,000 y/y and 6,000 m/m in December and the unemployment rate ticked higher, increasing the chances of the country’s central bank lowering its key interest rate. According to an early estimate from the Office for National Statistics, the unemployment rate moved from 5.1% in November to 5.2%, matching the economist consensus expectation. It is the highest level since January 2021.
Meanwhile, the number of unemployment claims was higher by 28.6k in January relative to the last month of 2025. Economists expected the number to ascend by only 22.8k following the 2.7k increase in December. The labor market softness caused wage growth to moderate with average earnings ex-bonus up 4.2% y/y in December, which matched the economist consensus estimate but was a deceleration from 4.4% in November. When including bonuses, compensation growth slowed from 4.6% to 4.2% in December. Economists anticipated that the y/y growth would match November’s pace.
After a record high January increase, the average asking price of newly listed homes in the UK was unchanged this month on both a y/y and m/m basis, according to the Rightmove House Price Index. In January, listing stickers were up 2.8% m/m and 0.5% y/y, leading to the combined January and February result being the strongest since 2020.
January price pressures in Canada were softer than expected with the Consumer Price Index being flat m/m and up 2.3% y/y. Economists anticipated rates of 0.1% and 2.4% after December’s 0.2% m/m slip and 2.4% y/y climb.
The Core CPI, which excludes items with volatile prices, was slightly hotter, depicting 0.2% m/m and 2.6% y/y hikes. The m/m result picked up from December’s 0.4% decline while the y/y print was down from 2.8%.
Within the broad CPI, the clothing and footwear category and the recreation, education and reading segment were 0.5% and 0.4% more costly than during December. Also contributing to the headline were the health and personal care category and the food group with gains of 0.3% and 0.1%. Conversely, the transportation segment, the household operations, furnishing, and equipment category and the shelter classification were 0.7%, 0.4% and 0.1% lower.
December manufacturing sales, after dipping 1.3% m/m in November, were up 0.6% m/m during the final month of 2025, exceeding the economist consensus estimate of 0.5%. Transactions strengthened in 12 of the 21 subsectors.
Motor vehicles and food products, with gains of 12% and 2% contributed the most to the positive print. Motor vehicle sales picked up due to higher activity at a plant in Ontario following the resolution of a semiconductor shortage. Coal and petroleum products, however, declined. Despite the strong m/m performance, the metric was down 1.1% relative to the same period in 2024.
For specific platform feedback and suggestions, please submit it directly to our team using these instructions.
If you have an account-specific question or concern, please reach out to Client Services.
We encourage you to look through our FAQs before posting. Your question may already be covered!
Information posted on IBKR Campus that is provided by third-parties does NOT constitute a recommendation that you should contract for the services of that third party. Third-party participants who contribute to IBKR Campus are independent of Interactive Brokers and Interactive Brokers does not make any representations or warranties concerning the services offered, their past or future performance, or the accuracy of the information provided by the third party. Past performance is no guarantee of future results.
This material is from IBKR Macroeconomics, an affiliate of Interactive Brokers LLC, and is being posted with its permission. The views expressed in this material are solely those of the author and/or IBKR Macroeconomics and Interactive Brokers is not endorsing or recommending any investment or trading discussed in the material. This material is not and should not be construed as an offer to buy or sell any security. It should not be construed as research or investment advice or a recommendation to buy, sell or hold any security or commodity. This material does not and is not intended to take into account the particular financial conditions, investment objectives or requirements of individual customers. Before acting on this material, you should consider whether it is suitable for your particular circumstances and, as necessary, seek professional advice.
Trading in digital assets, including cryptocurrencies, is especially risky and is only for individuals with a high risk tolerance and the financial ability to sustain losses. Eligibility to trade in digital asset products may vary based on jurisdiction.
Investments in certain commodities (precious metals) may be subject to significant price volatility and often involve risks related to market fluctuations, liquidity constraints, geopolitical events, and changes in global economic conditions that could adversely affect their value.
U.S. Spot Gold trading through IB LLC accounts is only available to legal residents of the United States that do not reside in Arizona, Montana, New Hampshire, and Rhode Island.
Related Articles


The index feels heavy, Jose. And, from speaking with individuals in my personal life, money is tight. However, support at SPX 6800 remains intact.