
- Solve real problems with our hands-on interface
- Progress from basic puts and calls to advanced strategies
Interactive Options Course

Posted February 13, 2026 at 11:35 am
Winter storms disrupt not only travel and daily life but also the prices of essentials like energy, which in turn affect the broader economy.
Approximately half of all energy used in homes and 40% of all energy used in commercial buildings in the US is for heating and air conditioning. So, the farther the outdoor temperatures are from human preferences, the more energy society will consume.
Almost half of homes in the US are heated by on-site natural gas combustion, and most of the rest are heated by “electricity,” with natural gas power plants providing the single largest share of generation (about 43%).
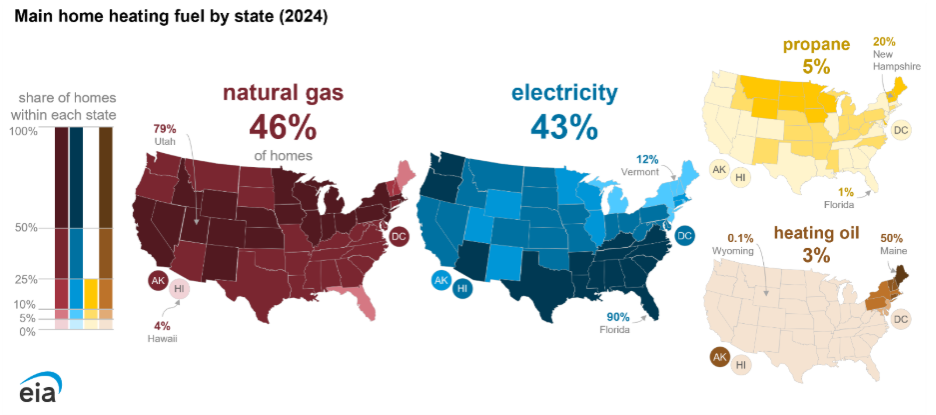
From the US EIA.
Thus, when it gets cold, natural gas becomes even more essential than it typically is.
The winter of 2026 has been very cold so far across the eastern half of the continental US. This cold was most intense during Winter Storm Fern from January 23rd through 27th, when much of the central and easter US averaged nearly 20°F colder than their typical temperatures.

From ClimateEngine.
During that period, nearly half of the US experienced minimum temperatures below 0°F, including parts of Texas, Oklahoma, and Arkansas.
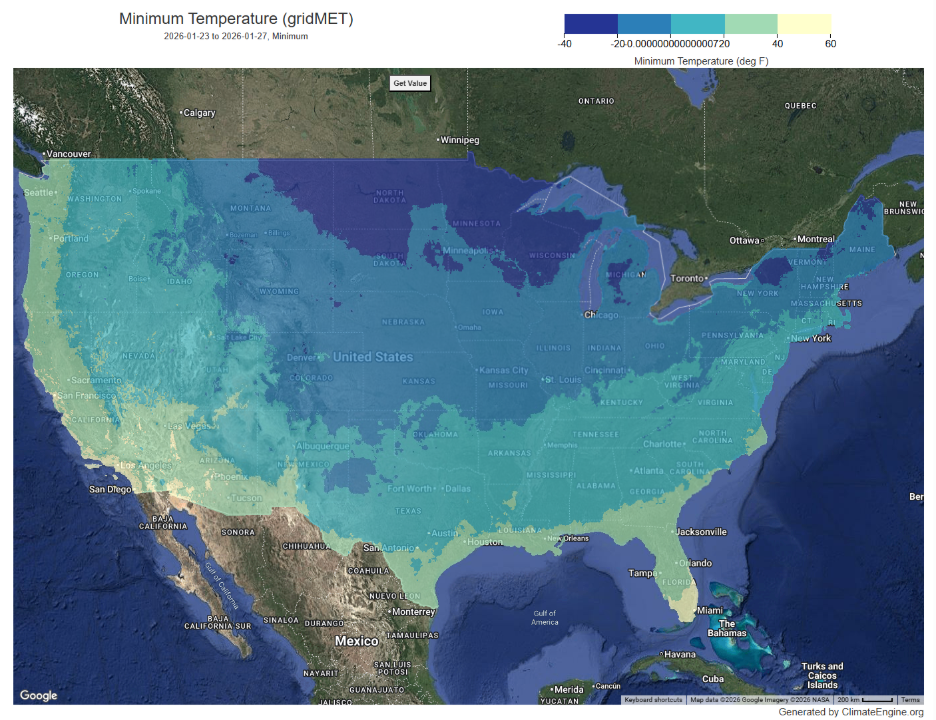
From ClimateEngine.
These cold temperatures had a profound impact on both the supply and demand for energy and, consequently, on the prices of wholesale electricity and natural gas.
The figure below illustrates. It shows the daily mean temperature (black), local electricity demand (red), and local wholesale electricity prices (blue) from January 12 through February 7th 2026, in Chicago (upper left), New York City (upper right), Los Angeles (lower left), and Dallas (lower right).
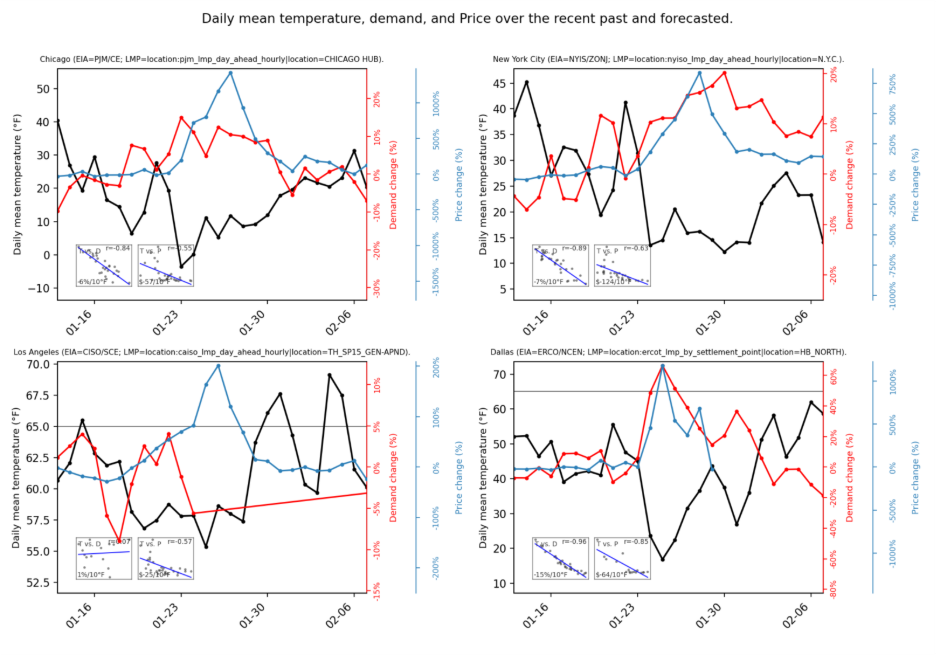
Produced with Python Matplotlib with data from ERA5, US EIA and Gridstatus.
In general, temperature and electricity demand are tightly linearly correlated, where a cold day is highly predictive of more electricity demand (in the winter).
Not only are the correlations strong, but the magnitude of variation in electricity demand is also large enough to be quite consequential – on the order of several tens of a percent.
For example, in Dallas, temperatures dropped from about 45°F on January 23rd to about 15°F on January 25th, causing a roughly 60% increase in electricity demand over just a couple of days.
As large as that change is, the change in wholesale electricity prices was even larger. In “deregulated” electricity markets, wholesale electricity prices reflect local marginal prices. The price is determined by the last unit required to meet demand, not by the average cost of the entire system. When the system has ample spare capacity and a flexible fuel supply, incremental demand is met by similar marginal resources, and prices move moderately. When the system is tight, the marginal unit can shift abruptly to scarce or constrained resources, and prices can jump nonlinearly.
This means that the greater the electricity demand, the more it is supplied by disproportionately higher-cost generation sources. In New England, for example, nearly 40% of the grid output came from more expensive oil-fired plants during the event because the natural gas supply was constrained.
The result is that relatively small changes in demand can produce highly nonlinear price spikes.
This effect is particularly strong when weather affects both the energy supply and demand.
For example, PJM Interconnection, the largest US regional grid serving about 67 million people, reported pipeline constraints and restricted natural gas supplies along the Eastern seaboard, as well as transmission bottlenecks that limited the ability to move cheaper power across the PJM footprint, resulting in nearly 21 gigawatts (GW) of generation outages during the storm.
The storm also affected energy infrastructure beyond the power grid. US oil producers temporarily lost up to 2 million barrels per day of crude output, with the Permian Basin accounting for much of the reduction. Equipment froze, and compressor and processing facility shutdowns were reported. Power outages and hazardous conditions created additional operational challenges.
The result of these dynamics was that energy prices spiked proportionately much more than energy demand.
The Henry Hub spot price for natural gas, a commonly used industry benchmark, surged roughly 1,000% during Winter Storm Fern and local electricity prices in Chicago, New York, and Dallas, mirrored this increase.
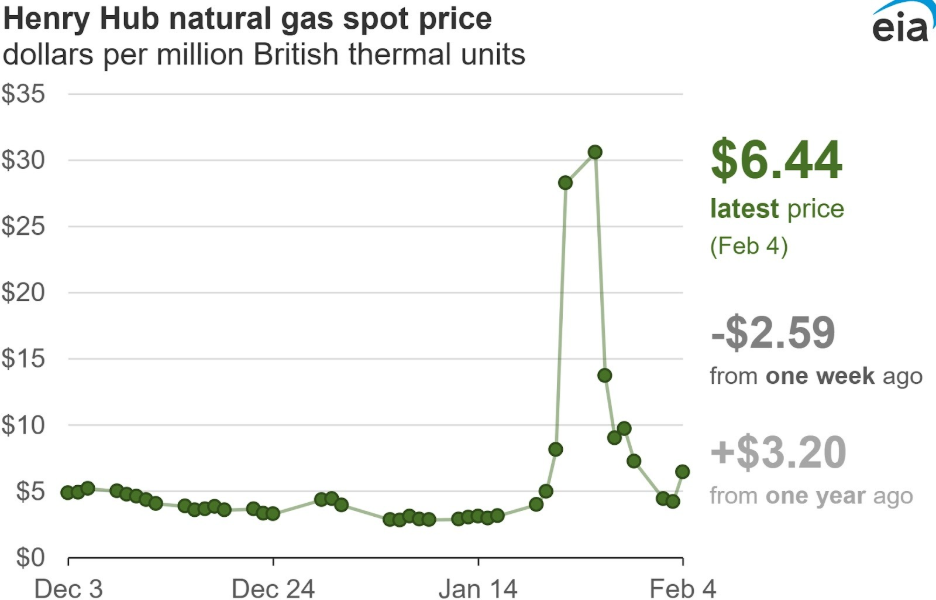
From the US EIA
Interestingly, Los Angeles was completely insulated from Fern’s physical impacts, yet wholesale electricity prices increased by roughly 200%, indicating the systemic nature of energy delivery.
Wholesale price spikes are not immediately reflected in consumer-facing retail electricity rates, which are often set by regulated tariffs and do not move day to day. Nevertheless, utilities will seek to recover their costs in the long run; thus, consumers should expect price increases over months to years.
The consumer price index (CPI) can provide context for how energy costs eventually reach consumers, but it should be treated as a lagging and smoothed indicator rather than a measure of storm severity. CPI energy reflects retail prices paid by households, not wholesale volatility, and it is constructed on a monthly cadence with seasonal adjustment that can make event-specific signals harder to isolate in real time.
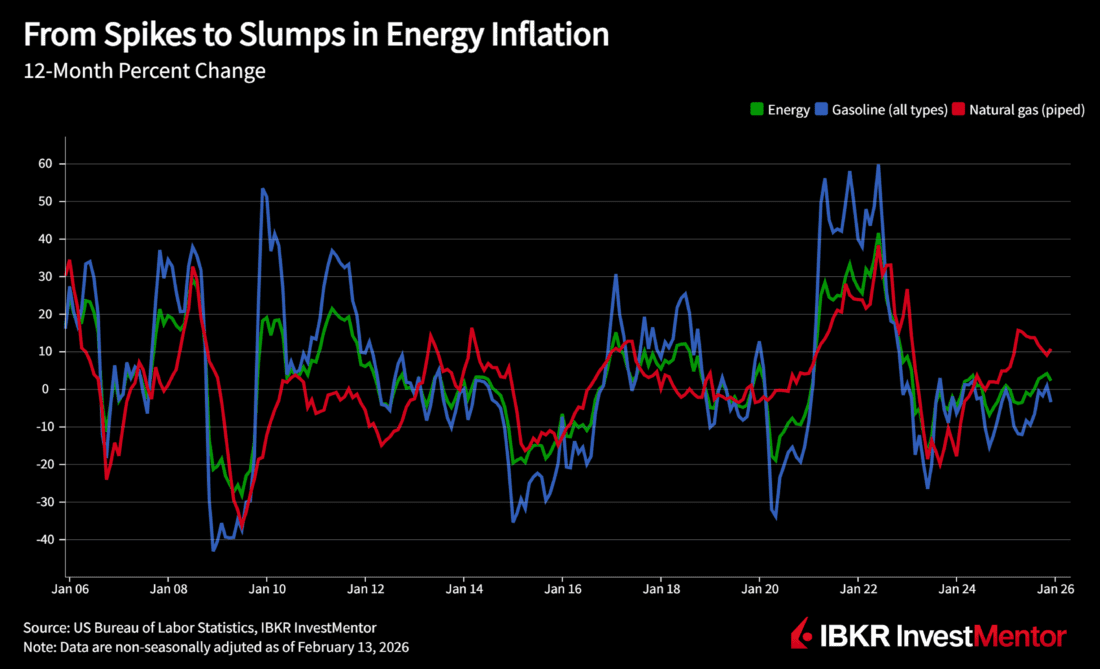
In January 2014, CPI rose 0.1% on a seasonally adjusted basis, with energy contributing. Over the prior 12 months, the energy category moved higher, and electricity and piped natural gas showed year-over-year increases.
In February 2021, CPI rose 0.4% on a seasonally adjusted basis. Retail energy prices moved, but far less than wholesale markets. Electricity rose 0.7% month-over-month, natural gas rose 1.6%, and the overall energy index rose 3.9%. The main takeaway is not the exact CPI print, but the scale difference. Wholesale markets can reprice in hours, while CPI reflects retail pass-through that is partial in the first month and often continues to filter through later.
This timing is consistent with how utility pricing works. Some pass-through can occur within 0 to 2 months where fuel riders or variable-rate structures reset quickly. The fuller effect more commonly shows up over 3 to 12 months through fuel-cost adjustments, procurement resets, and periodic retail rate updates. Large events can create a longer tail of 12 to 24 months or more through rate cases, infrastructure cost recovery, and financing-related surcharges.
Focusing on wholesale prices alone also understates the broader impacts on people and the economy. Many of the costs households experience are not captured cleanly by monthly retail price measures. Outages, unsafe conditions, property damage, lost work hours, emergency purchases, temporary relocation, and disrupted services can create immediate hardship and out-of-pocket expenses even if retail energy rates do not surge in the same month.
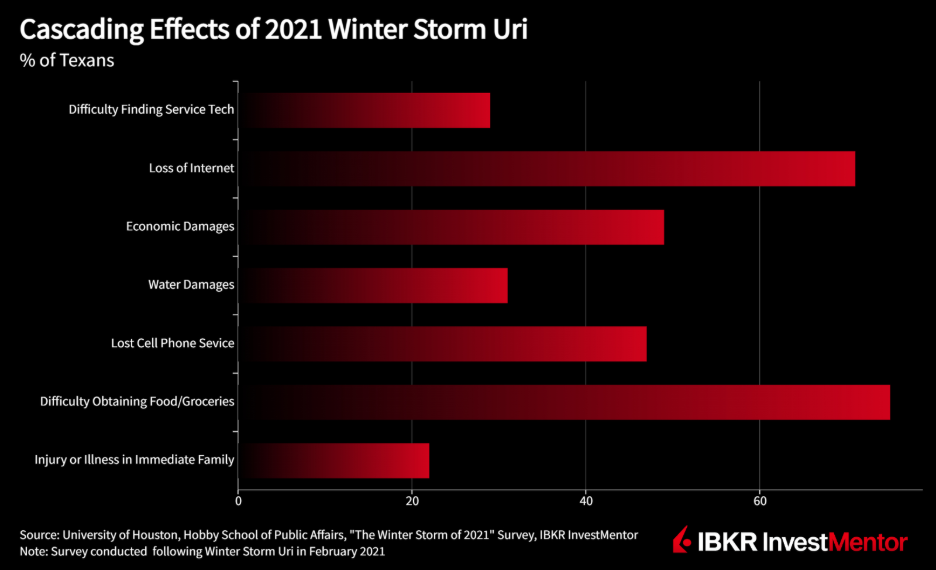
These effects can be widespread. During Winter Storm Uri, millions of households lost power at the peak, in many cases for multiple days. At the economy-wide level, storms can impose large losses through damaged infrastructure, delayed production, and supply chain interruptions. Uri has been estimated to have caused $80 to $130 billion in total economic losses, with agricultural losses reported at more than $600 million. Texas A&M AGRI life highlighted the damages included:
For consumer prices specifically, the key point is timing and distribution. Some costs are absorbed first by utilities and market participants and then recovered later through fuel-cost adjustments, procurement resets, and retail rate cases. This spreads costs across customers and across time. It also means the consumer impact may be felt as a gradual increase in monthly bills rather than a single spike, and the CPI response may appear modest even when underlying system stress and total economic losses are large.
Overall, extreme winter weather can drive large and fast moves in energy prices, but the signal is not purely local. Because power and gas markets are interconnected, pricing can reflect stress in adjacent regions and along shared fuel, pipeline, and transmission corridors, even when conditions at a specific location are relatively mild.
Cold temperatures were the most direct initial cause of the disruption, but supply resilience determines the magnitude of the price response. In several regions, demand rises by tens of percent while wholesale power and gas prices rise by many hundreds of percent. In recent events, we saw forced outages, fuel-delivery limits, and transmission bottlenecks turn a demand surge into extreme scarcity pricing.
For readers, the most useful framing is a layered one. Use temperature and demand to explain why stress appears. Use wholesale prices and system constraints to explain why prices can move nonlinearly. Then separate wholesale volatility from consumer exposure by explaining how regulated retail rates and cost recovery work, including the typical lag before higher system costs reach bills and CPI. This keeps the story grounded in observable prices and costs while using CPI only as a secondary reference for when consumer-facing inflation signals tend to show up.
To learn more about how events like this impact you, download IBKR InvestMentor.
Information posted on IBKR Campus that is provided by third-parties does NOT constitute a recommendation that you should contract for the services of that third party. Third-party participants who contribute to IBKR Campus are independent of Interactive Brokers and Interactive Brokers does not make any representations or warranties concerning the services offered, their past or future performance, or the accuracy of the information provided by the third party. Past performance is no guarantee of future results.
This material is from IBKR InvestMentor, an affiliate of Interactive Brokers LLC, and is being posted with its permission. The views expressed in this material are solely those of the author and/or IBKR InvestMentor and Interactive Brokers is not endorsing or recommending any investment or trading discussed in the material. This material is not and should not be construed as an offer to buy or sell any security. It should not be construed as research or investment advice or a recommendation to buy, sell or hold any security or commodity. This material does not and is not intended to take into account the particular financial conditions, investment objectives or requirements of individual customers. Before acting on this material, you should consider whether it is suitable for your particular circumstances and, as necessary, seek professional advice.
Related Articles


 News")


Join The Conversation
For specific platform feedback and suggestions, please submit it directly to our team using these instructions.
If you have an account-specific question or concern, please reach out to Client Services.
We encourage you to look through our FAQs before posting. Your question may already be covered!