
- Solve real problems with our hands-on interface
- Progress from basic puts and calls to advanced strategies
Interactive Options Course

Posted February 3, 2026 at 11:15 am
Fixed income performed well in 2025, but we are proceeding cautiously, as we believe headwinds in the new year could cause the rally to stall.
2025 was a disquieting year for investors, as domestic policy gyrations and worrisome geopolitical developments created an elevated level of uncertainty. Yet, despite the troubling backdrop, investors gritted their teeth and continued buying – mainly due to a lack of volatility (save “Liberation Day”) and to a lesser degree, FOMO. This pushed a broad swath of markets, including precious metals, to their all-time highs, with only a brief respite in early April. It seemed as though nothing could derail the momentum of the bull market: not tariffs, war, government shutdowns, profligate fiscal largesse (and associated ballooning deficits), stubborn inflation, assaults on Fed independence, unbalanced labor markets, or slowing population growth. What all of this means for future returns will be important for investors, but we have written about most of these topics previously, so we won’t belabor them here. Rather, we look ahead to a few new themes that are emerging and share our thoughts on how we are approaching 2026.
Much has been written recently about the lack of affordability for many large expenditures, such as housing and cars, but also for utility bills in some parts of the country. Affordability differs from inflation, although they are related. The more something rises in price, or stays at an elevated price, without income growing in line with those increases, the less affordable it becomes. This is important because it diverts resources away from other purchases, which over time can hamper overall economic growth. So far that does not seem to be the case.
Housing affordability has been described as a crisis in America. Below are charts of the FHFA House Price Index for the past two years and of average weekly earnings for the same period:
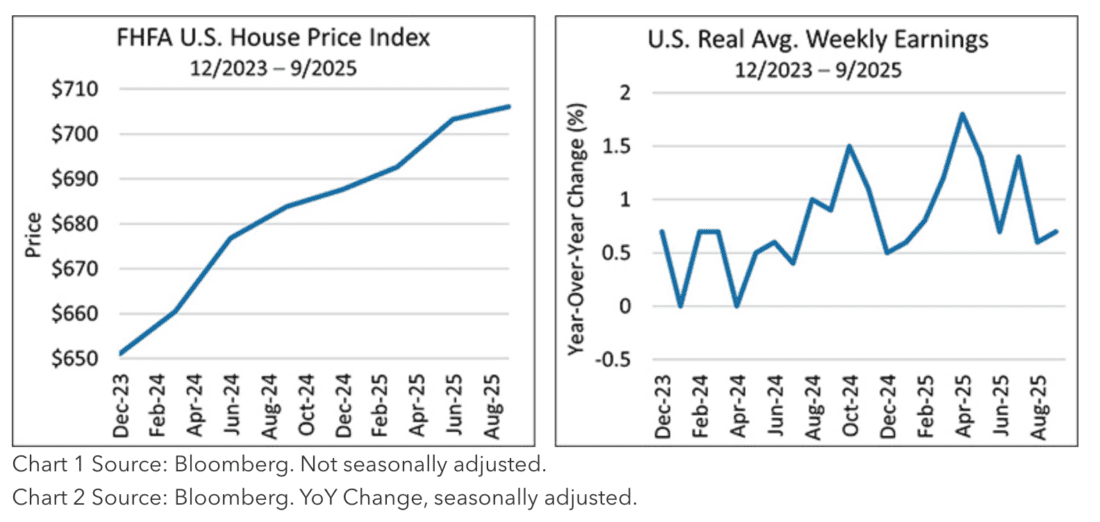
As you can see, income has not kept up with housing prices. Lower interest rates will not solve this problem, as prices are primarily a function of supply and demand (not exclusively interest rate levels), and in fact could make things worse by increasing demand, causing prices to move higher.
Similar patterns have emerged for automobile prices, which have risen quite a bit in the last five years for both new and used cars. Various sources estimate that the average cost of a new car over the same period rose 30% to ~$50,000, and the average price of a three-year-old used vehicle increased ~40% to ~$31,000. The average monthly car payment on a new car is now about $750. Lending terms are stretching beyond the typical five-year loan to six- and seven-year loans, with some up to 100 months (8+ years!). No wonder that the average age of cars on the road is now 12.8 years! This is not a healthy situation. Like the housing market, lower interest rates will not reduce car prices. Lower metal and manufacturing costs, combined with weaker demand, should do the trick.
This brings us to the next theme, the K-shaped economy. Simply put, the U.S. population can be divided between the “haves,” some top percentile, and the “have-nots,” everyone else. This is not a new concept, as we have always had these cohorts, but the terminology is new, perhaps due to a widening gap between the two. The high earners and wealthiest are largely insulated from the affordability crisis, given their higher incomes and increased wealth from their ever-expanding investment portfolios, but they may still exhibit more conservative buying patterns if news headlines remain unsettling. They are represented by the rising upper arm of the letter K. The lower-income cohort has not experienced a meaningful wealth effect from rising financial markets and are falling further behind, as wage growth has lagged price increases and savings are likely being tapped. They are represented by the declining lower arm of the letter K. Rising tides have not lifted all boats, despite reasonably healthy economic growth.
Another challenge we are all dealing with is a decline in the quality of the data we rely on to understand what is happening in the economy. For example, Q3 Real GDP growth was a very positive surprise at 4.3%, vs. 3.8% in Q2. Ostensibly, the growth was driven by contributions from lower inventory drawdowns, strong exports, and real final sales, meaning consumer spending was robust despite the headwinds above. But in our view, the strong GDP growth feels overstated relative to what we are seeing in the economy, and we also expect it may be subject to significant revisions, as the government shutdown caused low data collection rates that forced the bean counters to make a number of subjective assumptions. Stay tuned.
We are seeing similar issues with other key economic indicators, including the latest CPI report, which diverged greatly from the GDP Price Index, an alternative inflation gauge also published by the Bureau of Labor Statistics (BLS). The Q3 GDP Price Index was 3.8% while the reported November CPI was 2.7%. Although they cover different time periods and use different methodologies, they are quite far apart, which demonstrates how recent first cuts of the data may be less reliable than usual. For example, in the CPI, goods price data collection rates were very low in November and skewed to the last two weeks of the month as price checkers got back to work. This period coincides with many Black Friday/Cyber Monday deals, which could be giving us a false reading for the entire month. Also, as Nick Timiraos of The WSJ pointed out, the BLS assumed that the change in Owners Equivalent Rent (OER), which is a BLS homeowner survey proxy for housing costs (accounting for a third of CPI) was zero for the month. This is very unlikely, but given its heavy weight in the CPI, and the low data collection rates during the shutdown, it was another potentially inflation-dampening input. More to come.
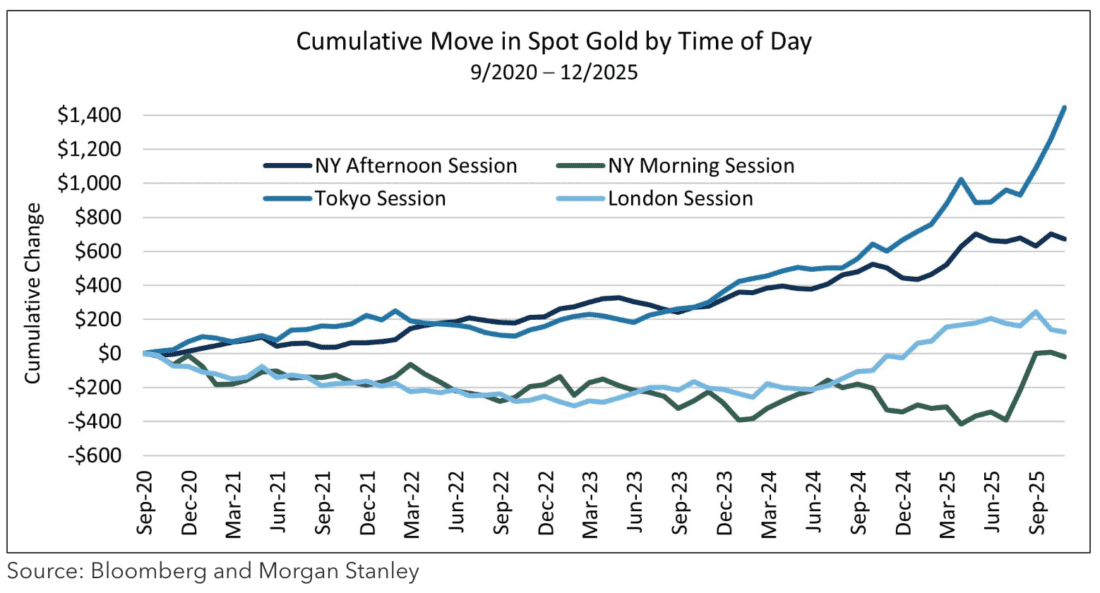
Fed independence is another ongoing concern, and it appears to be eroding under intense pressure from the White House to lower rates, which happened again in December. Throughout history, past administrations have tried to influence the Fed, but today we have overtly partisan nominations of new Fed governors and a new Chairman next year who shares the administration’s desire to lower rates regardless of what the data would normally call for. We ask ourselves why the last cut was needed given that the economy is reasonably healthy and many equity markets are near all-time highs? Perhaps even the Fed doesn’t believe in the integrity of the numbers? Add to that, commodity prices for some metals, such as gold and silver, are also breaking records. Granted, these are not as heavily used in industry as other metals, so some speculative hedging of currencies or safe-haven bets against the degradation of the dollar may be at work here. Also, Arbor Research points out that roughly 65% of the gains in gold occurred during Asian trading hours, suggesting Asian central banks are large buyers of the precious metal, as illustrated in the chart below:
Silver, which has broken all-time price records, retreated a bit during the last days of the year, but in keeping with the 2025 bullish action, quickly recovered.
The utility function for copper and aluminum is real, because they are widely used in manufacturing and housing. While off from its pandemic highs, aluminum has seen its price increase substantially over the last two years and copper has seen a similar rise, as shown in the charts below:
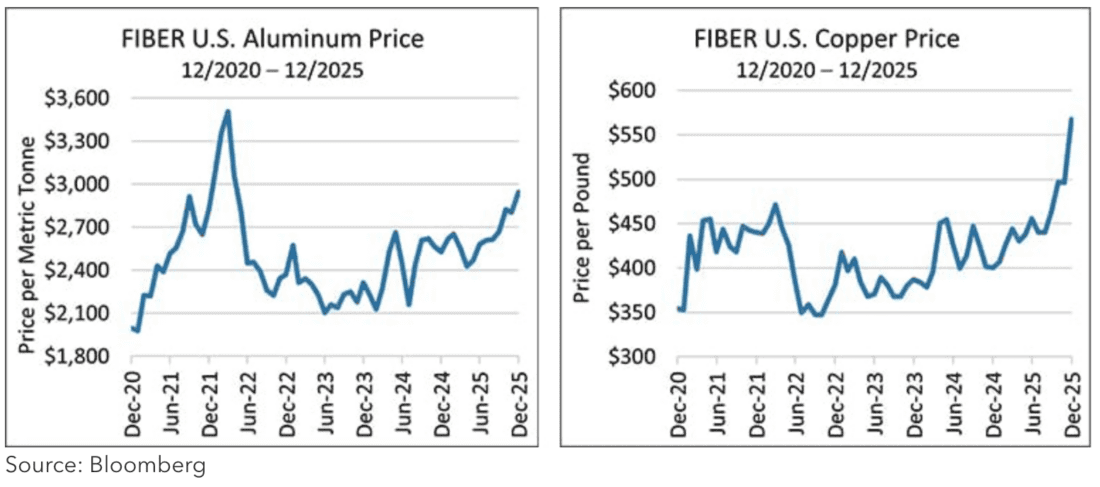
These are not speculative vehicles like gold and sometimes silver, but real economic inputs to manufacturing. Our conclusion is that supply is inadequate to meet economic demand. Does this look like the appropriate backdrop to increase economic stimulus? We do not think so.
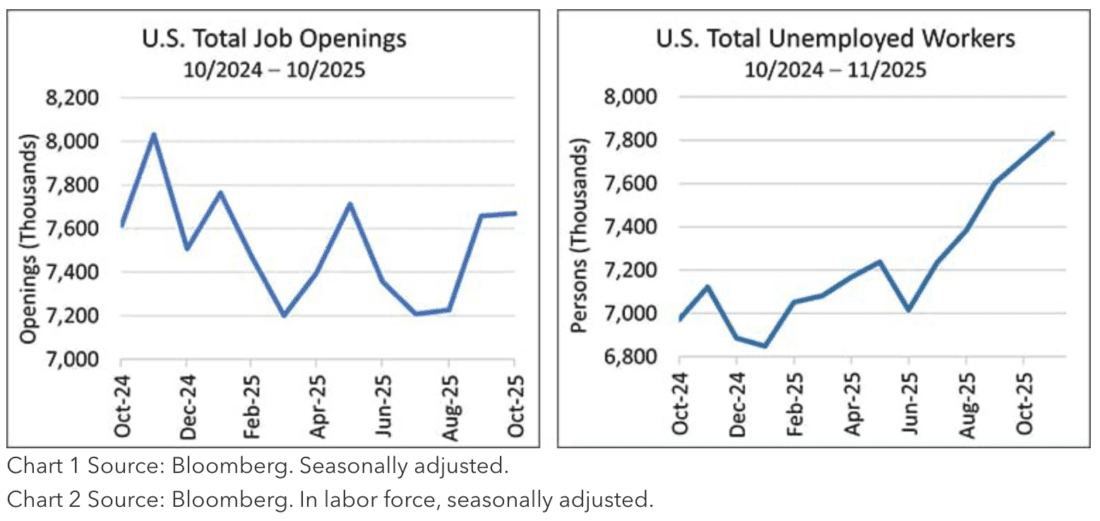
Clearly the Fed is now focusing on its full employment mandate. However, evidence is scant that there is a large problem here. Job creation has been a bit slower than it has been historically, but given that the population/labor pool (i.e., the denominator for the unemployment rate) may be shrinking due to the administration’s aggressive immigration policies, it can rise even without big changes in the number of unemployed people. This implies that we could be near full employment, despite the unemployment rate drifting higher. Moreover, the number of job openings nationwide is very close to the total number of unemployed. As the JOLTs data below shows, job openings have remained fairly flat over the past year, and even though the total number of those facing unemployment has increased, it is still roughly equivalent to the available openings (note: the largest rise in unemployed workers occurred during the recent government shutdown – coincidence?):
This situation indicates a skills mismatch, which should close in time, or we may continue to experience a structural skills mismatch and slightly higher unemployment. We hope for the former.
What does this mean for 2026 and beyond? There is considerable uncertainty given questions related to affordability, the K-shaped economy, data integrity, and the ability of the Fed to navigate a challenging landscape. As always, we are focusing on what we know.
If history is a guide, returns for future periods following the current high valuations in equity markets could be subdued at best. Not many would argue that stocks are cheap now, although there are some sector differences. We have shown the tables below before, but they bear repeating. For the period following 2000, equity returns lagged high yield bond returns for many years. We show five-, ten-, and 20-year annualized returns for major asset classes following the 2000 peak (the green shaded areas represent periods when high yield was the best performing asset class):
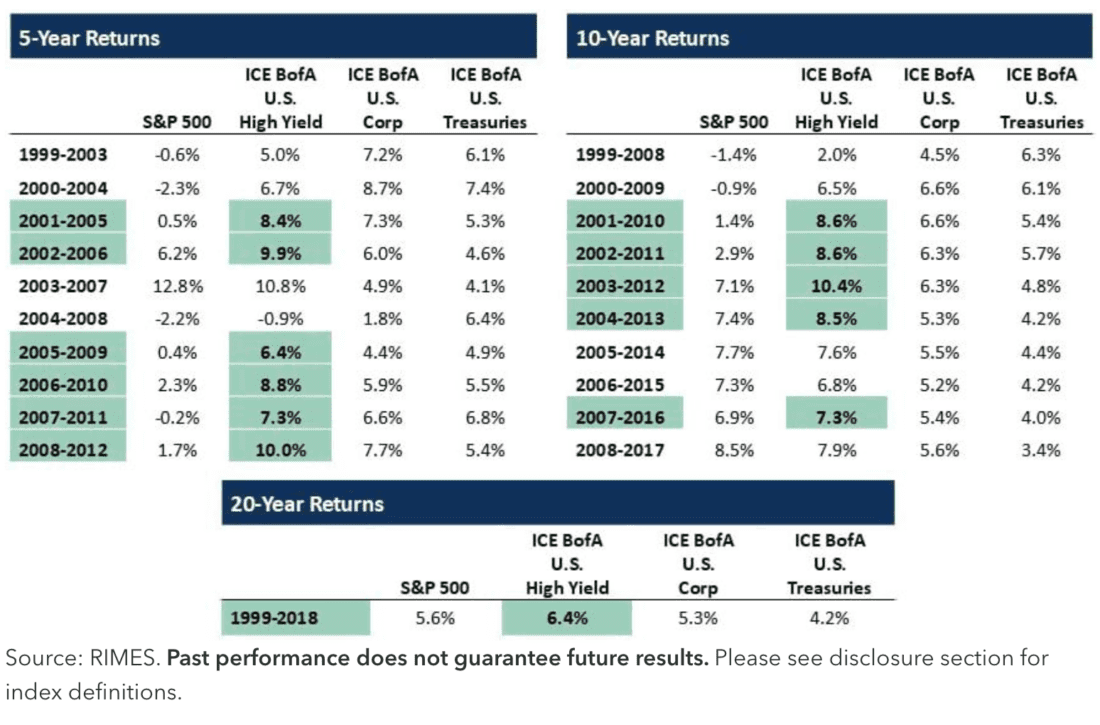
Quite eye opening.
Our view is that there are times when investors should favor a more defensive posture. We believe that this may be one of those times. As the saying goes, “trees do not grow to the sky,” and given the robust performance we have experienced in equities, precious metals, and some international and emerging markets, perhaps it is time to count one’s blessings, put some chips in the bank, and wait for better opportunities. We may have taken a defensive posture too early and missed some upside in 2025, but returns were acceptable, and we slept a little easier knowing the proverbial investment sword of Damocles was not hanging over our heads.
We will wait for better entry points in the new year. There are some cracks emerging, such as the recent selloff in crypto and some AI-related sectors. Also, on December 29th silver plunged, although it recovered quickly, so hopefully we are getting closer to seeing more rationality in prices. While we do not know what the future will bring, we are skeptical that the torrid pace of valuation expansion we have seen in some sectors (e.g., AI, nuclear) is sustainable or repeatable. Therefore, we are cautiously optimistic that we can avoid a major collapse, but fearful that future returns could be anemic. We are keeping a healthy buying reserve and focusing on companies that can weather the storm, if that’s what is coming, or thrive in a more balanced economy and orderly repricing.
Here’s to continued progress in 2026! We thank you for your confidence in our management.
—
Originally Posted on January 13, 2026 – First Quarter Strategic Income Outlook
Information posted on IBKR Campus that is provided by third-parties does NOT constitute a recommendation that you should contract for the services of that third party. Third-party participants who contribute to IBKR Campus are independent of Interactive Brokers and Interactive Brokers does not make any representations or warranties concerning the services offered, their past or future performance, or the accuracy of the information provided by the third party. Past performance is no guarantee of future results.
This material is from Osterweis Capital Management and is being posted with its permission. The views expressed in this material are solely those of the author and/or Osterweis Capital Management and Interactive Brokers is not endorsing or recommending any investment or trading discussed in the material. This material is not and should not be construed as an offer to buy or sell any security. It should not be construed as research or investment advice or a recommendation to buy, sell or hold any security or commodity. This material does not and is not intended to take into account the particular financial conditions, investment objectives or requirements of individual customers. Before acting on this material, you should consider whether it is suitable for your particular circumstances and, as necessary, seek professional advice.
Related Articles


Join The Conversation
For specific platform feedback and suggestions, please submit it directly to our team using these instructions.
If you have an account-specific question or concern, please reach out to Client Services.
We encourage you to look through our FAQs before posting. Your question may already be covered!