
- Solve real problems with our hands-on interface
- Progress from basic puts and calls to advanced strategies
Interactive Options Course

Posted December 3, 2025 at 10:15 am
In financial markets, prices move not only because of earnings, margins, or cash flows, but also because of the story the market decides to believe. Periods of strong pessimism can emerge even when a company’s underlying financial results remain resilient. And sometimes, the most significant rallies begin precisely in those moments of disconnect.
The recent performance of Google’s parent company, Alphabet, offers a clear illustration. While the company was steadily expanding revenue and net income, the prevailing narrative for months suggested that Google faced an existential threat from the rise of large language models (LLMs) such as ChatGPT.
Yet shortly after the most pessimistic headlines peaked, Google stock rallied sharply, climbing roughly 86% over six months.
Understanding why this happened can help investors evaluate similar situations in the future, without making predictions or giving investment advice.
Narratives are persuasive because they simplify complexity. In Google’s case, the idea that “AI will kill search” spread rapidly and seemed intuitively plausible. Millions of users were experimenting with generative AI tools for tasks previously performed through search engines.
But while the story was evolving, Google’s fundamentals were sending a different message:
Revenue line chart with TTM + 5-year + 10-year growth rates, highlighting accelerating growth despite negative sentiment.
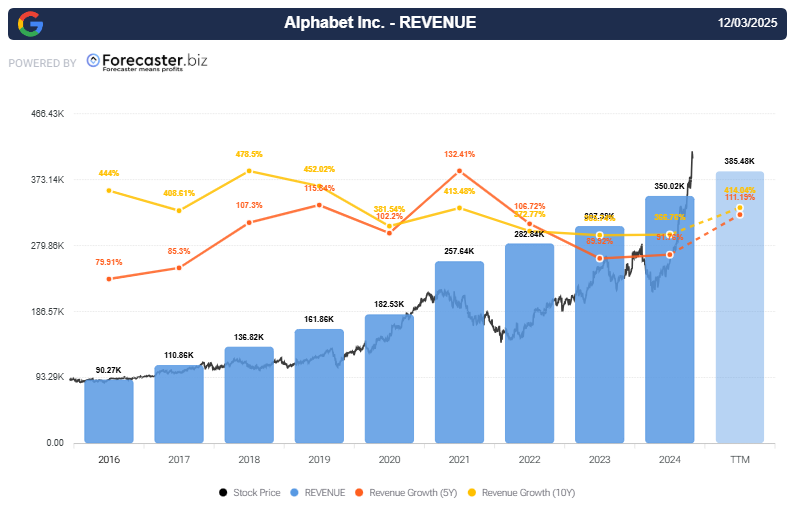
Google price chart vs. revenue growth (TTM + 5y + 10y) from Forecaster — showing the divergence between the falling stock price and rising fundamentals. Source: Forecaster Terminal
Meanwhile, the stock price was under pressure precisely because the narrative was overwhelmingly negative.
This divergence between pessimistic perception and improving performance is a recurring feature of market behavior.
When sentiment turns negative, fundamentally strong companies often exhibit three recognizable patterns:
Even while Google’s valuation declined, revenues and net income expanded steadily.
Google’s 5- and 10-year growth metrics stayed resilient and even improved.
This is the “divergence” that often precedes market turnarounds, though not always.
Crucially, divergence alone does not imply future performance. It simply highlights when perception and reality are moving in different directions.

Google net income (TTM + 5-year + 10-year growth) overlaid with stock price, showing the structural improvement beneath the temporary decline. Source: Forecaster Terminal
In the Google example, the narrative did not shift all at once, it evolved through distinct stages that gradually redefined how the market viewed the company’s position in the AI landscape.
The first turning point came when Gemini began outperforming ChatGPT in several benchmark tests, challenging the early perception that Google was falling behind in generative AI. This alone softened the pessimistic narrative that had dominated headlines for months.
The second shift occurred when Google revealed that Gemini 3 was running on internally developed microchips rather than relying on Nvidia hardware. This breakthrough changed the conversation from “Google is threatened by AI” to “Google is building core AI infrastructure independently.”
The narrative strengthened further when Meta publicly expressed interest in adopting Google’s TPU chips for its own large-scale AI workloads. At that point, the story flipped entirely: instead of being viewed as vulnerable to AI disruption, Google was increasingly seen as a potential challenger to Nvidia’s leadership in the AI hardware market.
Yet throughout all these shifts in perception, Google’s underlying financial results had been improving steadily long before investor sentiment began to change.

Google net income (TTM + 5-year + 10-year growth) overlaid with stock price, showing the structural improvement beneath the temporary decline. Source: Forecaster Terminal
Sometimes the narrative catches up to the numbers, and sometimes the numbers eventually validate the narrative. The key is understanding the gap between the two as it unfolds.
Other companies such as Adobe, PayPal, Novo Nordisk, and Nvidia offer similarly instructive examples. Each faces its own catalysts and challenges, yet all highlight the same underlying dynamic: market sentiment can move sharply in one direction even when a company’s operational performance is moving in another.
Narrative: “AI will replace Adobe’s creative tools.”
Fundamentals: Revenue and net income showing renewed acceleration.
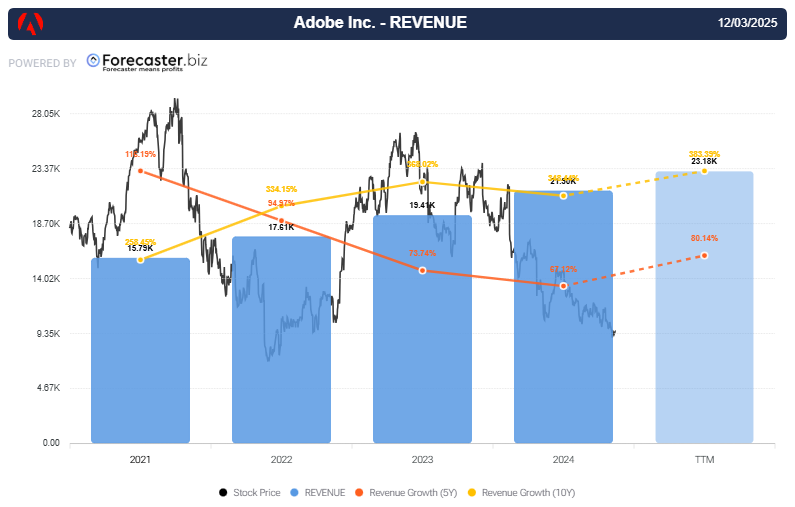
Adobe revenue chart (TTM + 5y + 10y growth) — highlighting improvement despite falling share price. Source: Forecaster Terminal
Narrative: “Growth is over; stock is overextended.”
Fundamentals: TTM data shows accelerating revenues and record net income.
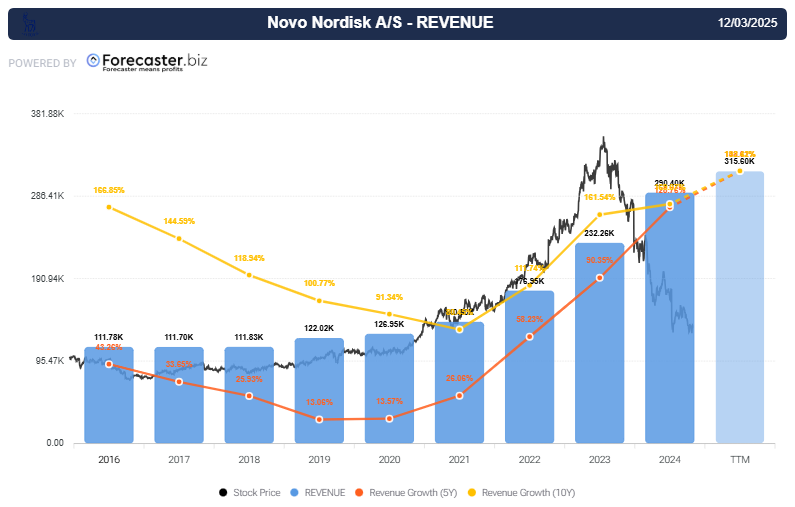
Novo Nordisk revenue + stock price divergence chart, highlighting rising fundamentals vs. falling price. Source: Forecaster Terminal
Narrative: “The business model is outdated.”
Fundamentals: Growth rates stabilizing after several years of decline.
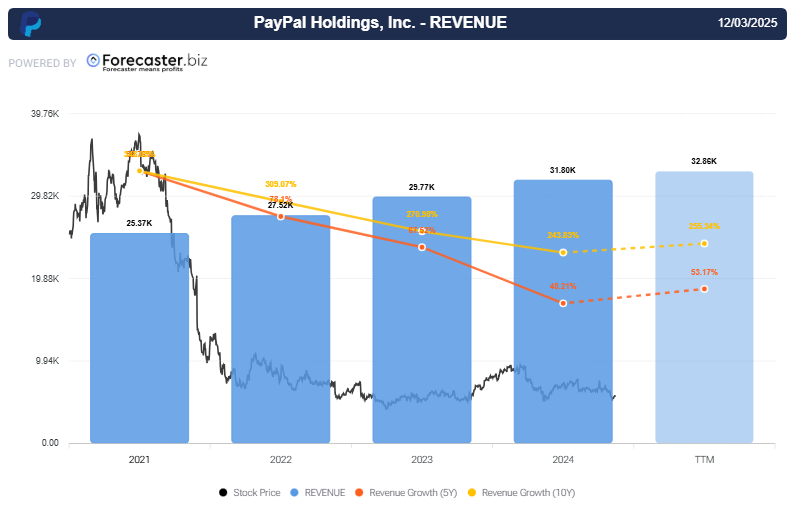
PayPal growth metrics + price chart, showing early signs of fundamental reacceleration. Source: Forecaster Terminal
These examples are not forecasts. They simply show how the narrative surrounding a company can diverge sharply from its operating results.
The ranking section of the Forecaster Terminal includes a Best to Worst feature that helps users quickly identify companies with strong underlying fundamentals across any major global index. By sorting components based on valuation metrics, growth trends, and quality scores, this tool highlights firms whose financial profiles may warrant closer examination.
In the example above, the S&P 500 ranking reveals several of the companies discussed earlier, such as Adobe, PayPal, and Novo Nordisk—appearing near the top of the list. While this does not imply future performance, it offers a structured, data-driven way to surface potential opportunities within large equity benchmarks.
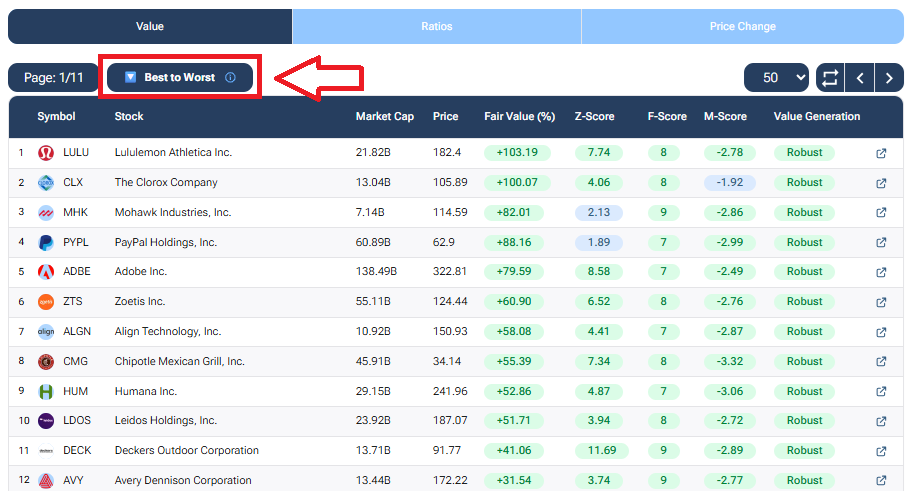
The Forecaster Terminal’s “Best to Worst” ranking tool allows users to quickly surface companies with strong fundamental profiles across any major index. In this example from the S&P 500, several firms showing solid valuation and growth metrics appear at the top of the list, offering a data-driven starting point for deeper analysis. Source: Forecaster Terminal
History shows that many major stock rallies begin in periods where:
But this does not imply that any specific company will rebound after a narrative downturn. It simply highlights that understanding both the story and the numbers can offer a more complete picture of market behavior.
Ultimately, markets may react to narratives in the short term, but over time, they tend to follow the trajectory of a company’s actual performance.
Disclaimer:
This article is for informational and educational purposes only and does not constitute investment advice, a recommendation, or an offer to buy or sell any financial instrument. Past performance is not indicative of future results. Investing involves risk, including the possible loss of principal.
—
Originally Posted on December 3, 2025
Information posted on IBKR Campus that is provided by third-parties does NOT constitute a recommendation that you should contract for the services of that third party. Third-party participants who contribute to IBKR Campus are independent of Interactive Brokers and Interactive Brokers does not make any representations or warranties concerning the services offered, their past or future performance, or the accuracy of the information provided by the third party. Past performance is no guarantee of future results.
This material is from Forecaster.biz and is being posted with its permission. The views expressed in this material are solely those of the author and/or Forecaster.biz and Interactive Brokers is not endorsing or recommending any investment or trading discussed in the material. This material is not and should not be construed as an offer to buy or sell any security. It should not be construed as research or investment advice or a recommendation to buy, sell or hold any security or commodity. This material does not and is not intended to take into account the particular financial conditions, investment objectives or requirements of individual customers. Before acting on this material, you should consider whether it is suitable for your particular circumstances and, as necessary, seek professional advice.


Join The Conversation
For specific platform feedback and suggestions, please submit it directly to our team using these instructions.
If you have an account-specific question or concern, please reach out to Client Services.
We encourage you to look through our FAQs before posting. Your question may already be covered!