
- Solve real problems with our hands-on interface
- Progress from basic puts and calls to advanced strategies
Interactive Options Course

Posted September 29, 2025 at 10:30 am
In my previous article we analyzed bitcoin, today we will deep dive in the Nasdaq 100 index.
When analyzing an index like the Nasdaq 100, fundamentals provide an essential anchor for valuation, complementing technical and macroeconomic perspectives.
According to the latest data from Forecaster Terminal, the index currently trades at 24,503 points and is estimated to be 1.20% undervalued relative to its fair value. This suggests that, despite the strong rally seen in recent months, the Nasdaq 100 still offers investors some margin of safety.
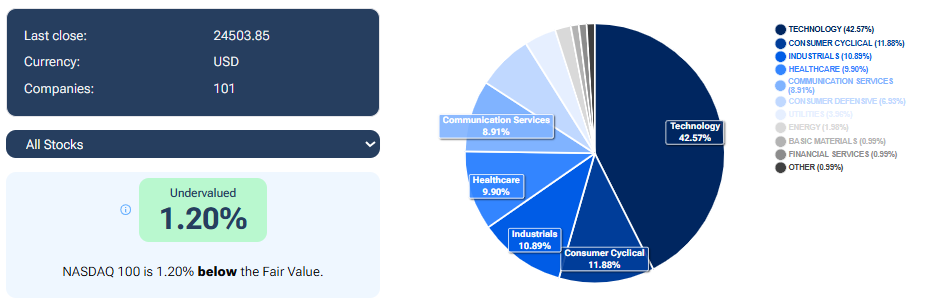
Fair Value analysis of the Nasdaq 100: according to Forecaster Terminal, the index is currently 1.20% undervalued. The calculation is based on the aggregated fair value of all 101 components, highlighting the strong weight of the technology sector (42.57%) within the index. – Source: Forecaster Terminal
From a historical perspective, the chart of earnings growth versus index price (see picture below) highlights the structural support behind the Nasdaq’s rise. Since 2016, the aggregate net income of Nasdaq 100 companies has grown from $236 billion to over $1 trillion in 2025. This represents more than a fourfold increase in earnings, a pace of growth that justifies much of the price appreciation we have witnessed over the past decade.
Even during periods of volatility—such as the pandemic shock in 2020 or the rate-hike-driven correction of 2022—corporate earnings provided a strong recovery backbone. The latest data shows the earnings line (green) catching up with the index price, signaling that valuations are being underpinned by real profitability rather than pure speculative momentum.
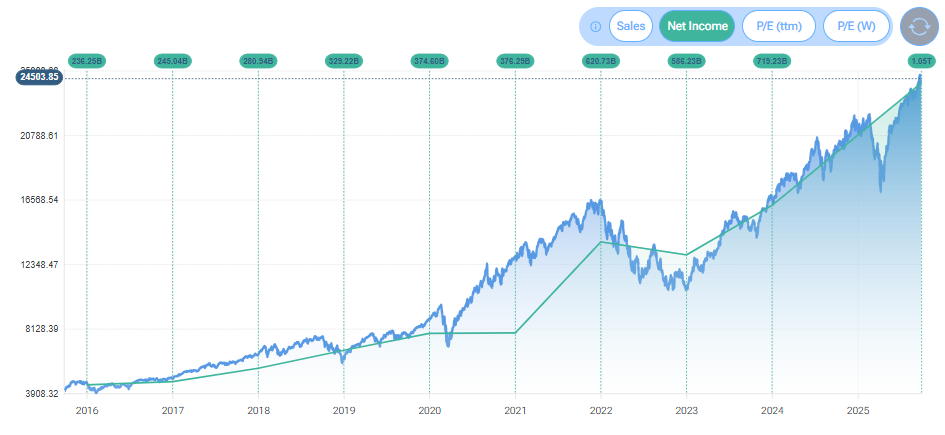
Nasdaq 100 price versus aggregate net income of its components. Since 2016, earnings have grown from $236B to over $1T in 2025, providing strong fundamental support to the index’s upward trend. Source: Forecaster.biz
Projection is Forecaster’s AI-powered pattern-matching engine that estimates probabilities for future price moves by comparing today’s market setup with similar moments in history. It identifies current patterns, finds the best historical matches, and groups outcomes into BULL and BEAR scenarios with clear probabilities.
Just as ChatGPT completes a sentence with the most likely word, Projection “completes” the market’s text with the scenario that has historically been most probable.
The Projection tool in Forecaster offers an AI-driven outlook on the future movements of the Nasdaq 100, analyzing historical market patterns to identify the most probable scenarios.
The most correlated past event is the bullish phase between October and December 2017, during which the index delivered positive performance despite temporary corrections. This reinforces the idea that strong historical analogues, combined with AI pattern recognition, can provide investors with valuable insights into market direction.
The Nasdaq 100 continues to demonstrate that its valuation is firmly supported by fundamentals, with earnings growth exceeding $1 trillion and providing a solid backbone for the index’s rise. While short-term volatility is always possible, both fair value analysis and AI-driven projections suggest the balance of probabilities favors continued upside. With technology companies at the core of its performance and innovative tools like Projection offering data-driven insights into potential scenarios, investors can approach the Nasdaq 100 with a clearer understanding of both risk and opportunity. In an environment where fundamentals and artificial intelligence converge, the index stands out as a compelling benchmark for growth-oriented strategies heading into year-end.
—
Originally Posted on September 29, 2025
Information posted on IBKR Campus that is provided by third-parties does NOT constitute a recommendation that you should contract for the services of that third party. Third-party participants who contribute to IBKR Campus are independent of Interactive Brokers and Interactive Brokers does not make any representations or warranties concerning the services offered, their past or future performance, or the accuracy of the information provided by the third party. Past performance is no guarantee of future results.
This material is from Forecaster.biz and is being posted with its permission. The views expressed in this material are solely those of the author and/or Forecaster.biz and Interactive Brokers is not endorsing or recommending any investment or trading discussed in the material. This material is not and should not be construed as an offer to buy or sell any security. It should not be construed as research or investment advice or a recommendation to buy, sell or hold any security or commodity. This material does not and is not intended to take into account the particular financial conditions, investment objectives or requirements of individual customers. Before acting on this material, you should consider whether it is suitable for your particular circumstances and, as necessary, seek professional advice.


Join The Conversation
For specific platform feedback and suggestions, please submit it directly to our team using these instructions.
If you have an account-specific question or concern, please reach out to Client Services.
We encourage you to look through our FAQs before posting. Your question may already be covered!