
- Solve real problems with our hands-on interface
- Progress from basic puts and calls to advanced strategies
Interactive Options Course

Posted September 10, 2025 at 12:15 pm
In recent months, artificial intelligence has made its way into nearly every corner of the financial world—from automated trading to natural language-driven research tools. One of the latest developments comes from the Forecaster Terminal, which has introduced a new functionality called Projection, designed to map current market conditions against past historical patterns and generate probabilistic scenarios for the future.
The screenshots below illustrate how this feature has been applied to the S&P 500 (GSPC) index over a three-month horizon.
The Projection tool highlights potential forward paths for the S&P 500 based on its similarity to previous market episodes. In this case, the model presents two main scenarios:
The probability distribution shows a 71% chance of a bullish continuation versus 29% for a bearish turn, while the robustness score stands at 3 out of 5, signaling moderate confidence.
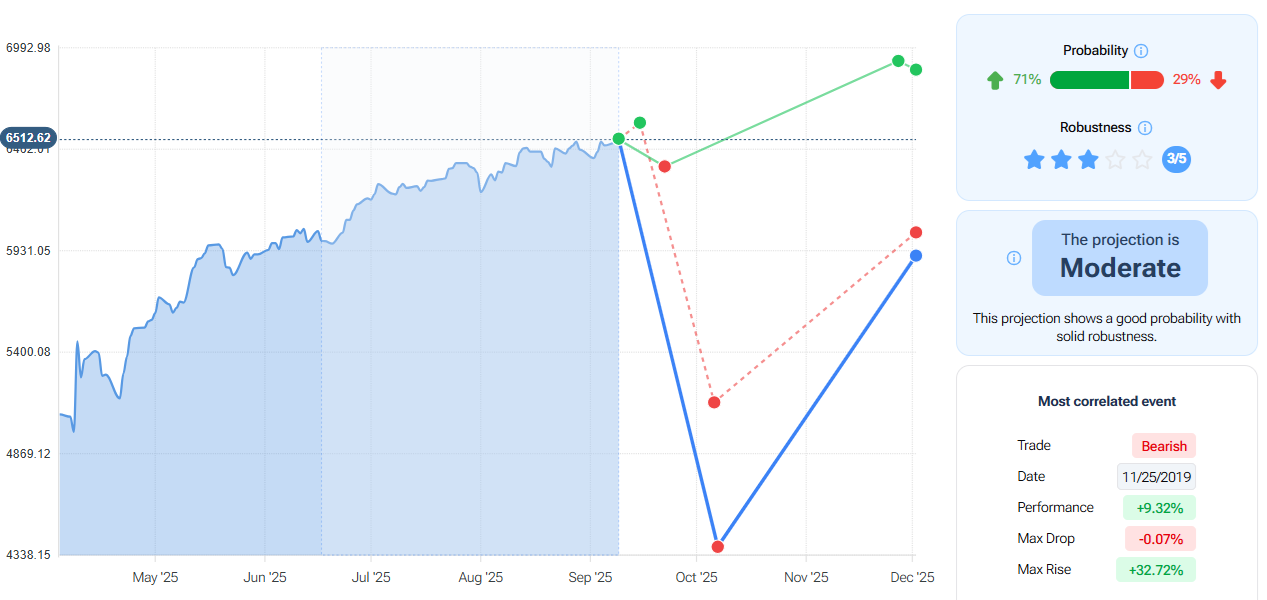
Historical pattern analysis suggests possible paths for the S&P 500 into late 2025, balancing bullish momentum with downside risk. – Source: Forecaster.biz
The tool also surfaces past periods that shared similar market dynamics. Among the bullish analogues are late 2019, early 2019, and episodes from 1995 and 1994, all of which ended with modest to strong gains and relatively limited drawdowns.
On the bearish side, the most correlated case comes from November 2019 to February 2020—a period that ultimately produced a +9.32% performance but also carried the seeds of volatility that would soon unfold in early 2020. Another analogue is October 2017, which posted a smaller gain but still showed meaningful swings.
These comparisons illustrate one of the strengths—and limitations—of projection-based analysis: while past behavior can help inform probabilities, no two market environments are ever identical.

Comparing past market patterns: the most correlated events range from 1994 to 2019, each with distinct risk–reward profiles. – Source: Forecaster.biz
It is important to emphasize that this approach is not intended to provide a single, deterministic forecast of where the market will go. Instead, it functions as a scenario-mapping framework, giving traders and investors a structured way to think about possible paths forward.
Rather than focusing on a fixed target price, the tool highlights probabilistic outcomes—the range of scenarios that are statistically more likely given current and historical market behavior. This probabilistic view helps market participants move away from “certainty-seeking” and toward risk-aware decision making.
A second benefit lies in the ability to assess risk/reward dynamics more transparently. By comparing potential maximum drawdowns against historical upside, investors can better evaluate whether a position offers an attractive profile, or if the balance tilts toward excessive risk. For example, a scenario showing limited downside with strong historical rebounds may justify a more constructive stance, whereas a high-volatility analogue may encourage greater caution.
Finally, the value of such a projection increases when it is integrated into a broader analytical framework. Combining scenario outputs with seasonality studies, macroeconomic indicators, or portfolio-level considerations provides a richer context for decision making. In this way, the tool serves less as a predictive oracle and more as a guide to informed scenario planning, supporting disciplined strategies in an environment where uncertainty is the only constant.
As artificial intelligence continues to influence investment decision-making, tools like Forecaster Terminal’s Projection provide a fresh perspective on market analysis. By blending pattern recognition with historical analogues, Projection can serve as a complementary input for investors who want to visualize possible paths ahead, while keeping in mind that probabilities do not equal certainties. For the S&P 500, the current projection suggests a moderate tilt toward continued strength, balanced by reminders from history that markets can—and often do—take unexpected turns.
—
Originally Posted on September 10, 2025
Information posted on IBKR Campus that is provided by third-parties does NOT constitute a recommendation that you should contract for the services of that third party. Third-party participants who contribute to IBKR Campus are independent of Interactive Brokers and Interactive Brokers does not make any representations or warranties concerning the services offered, their past or future performance, or the accuracy of the information provided by the third party. Past performance is no guarantee of future results.
This material is from Forecaster.biz and is being posted with its permission. The views expressed in this material are solely those of the author and/or Forecaster.biz and Interactive Brokers is not endorsing or recommending any investment or trading discussed in the material. This material is not and should not be construed as an offer to buy or sell any security. It should not be construed as research or investment advice or a recommendation to buy, sell or hold any security or commodity. This material does not and is not intended to take into account the particular financial conditions, investment objectives or requirements of individual customers. Before acting on this material, you should consider whether it is suitable for your particular circumstances and, as necessary, seek professional advice.
Related Articles


")


Join The Conversation
For specific platform feedback and suggestions, please submit it directly to our team using these instructions.
If you have an account-specific question or concern, please reach out to Client Services.
We encourage you to look through our FAQs before posting. Your question may already be covered!