
- Solve real problems with our hands-on interface
- Progress from basic puts and calls to advanced strategies
Interactive Options Course
Posted July 16, 2025 at 9:18 am
1/ Japan – Land of the Rising Stocks?
2/ China’s Rally Looks Strong—Until You Zoom Out
3/ U.K. – Mind the (Momentum) Gap
Investopedia is partnering with CMT Association on this newsletter. The contents of this newsletter are for informational and educational purposes only, however, and do not constitute investing advice. The guest authors, which may sell research to investors, and may trade or hold positions in securities mentioned herein do not represent the views of CMT Association or Investopedia. Please consult a financial advisor for investment recommendations and services.
Japan – Land of the Rising Stocks?
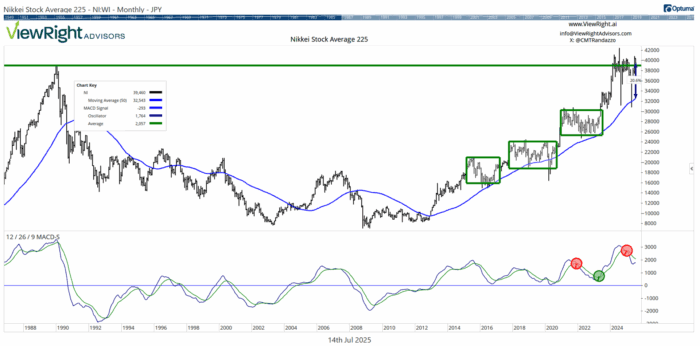
While Japan’s Nikkei 225 Index (NI225) has lagged many of the world’s major stock markets year-to-date, it continues to trade just above a key long-term breakout level, keeping alive the bullish thesis of a potential multi-decade trend shift. After finally surpassing its 1989 high near 39,000 early last year, the index has struggled to hold above that significant threshold amid slowing momentum and increased volatility.
The 1989 peak carries both psychological and technical importance, having loomed overhead as a constant reminder of a distant bubble peak for more than three decades. Today, it may be serving as a new floor—yet the market’s difficulty maintaining this level warrants caution.
A critical reference on the chart is the 50-month moving average, a long-term trend indicator that has steadily turned higher and acted as support for much of the past decade. However, after the Nikkei surged to nearly 40% above this moving average—its widest gap since the late-1980s asset bubble—the index stalled, entering a phase of choppy trading and sharp declines. One such decline recently tested the 50-month moving average, reaffirming its ongoing role as a dynamic support level. Despite this turbulence, the Nikkei still trades at a notable ~21% premium to its 50-month average, indicating that the longer-term trend remains extended and possibly vulnerable.
Adding to the cautious outlook, the monthly MACD indicator suggests the market may have entered a period of down-to-rangebound movement. This signals that further consolidation or sideways price action is likely in the months ahead before any sustained upward momentum can reassert itself. The green rectangles in the price chart below highlight previous multi-month periods of struggle accompanied by similar MACD sell signals.
In summary, while the long-term breakout remains intact for now, the path forward for Japan’s market appears uneven. Investors should expect volatility and a possible extended consolidation phase, making patience and risk management critical as the broader secular trend unfolds.

China’s Rally Looks Strong—Until You Zoom Out
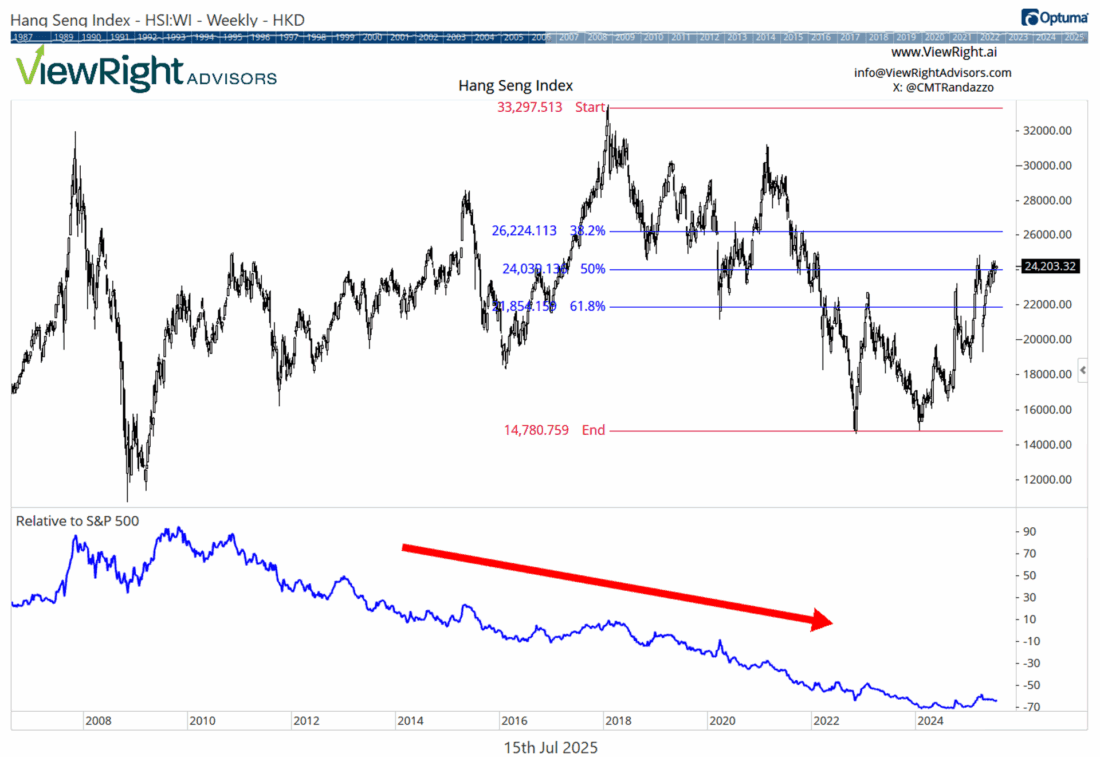
On the surface, China’s Hang Seng Index (HSI) appears to be staging a comeback. The benchmark is up more than 20% year-to-date, making it one of the strongest-performing major global indexes so far in 2025. But context is everything, and the bigger picture tells a far less impressive story.
Despite the recent strength, the Hang Seng hasn’t made a new high since February 2018, and the current rebound remains firmly within the boundaries of a long-term downtrend. The rally has brought the index back to the 50% Fibonacci retracement of its decline from that 2018 peak to the late-2022 bottom. This level often acts as resistance, especially when aligned with a broader bearish structure.
Zooming further out, the relative strength of the Hang Seng versus the S&P 500 Index reveals an even more sobering view. The ratio has been in a persistent downtrend since late 2009, highlighting China’s chronic underperformance compared to U.S. equities over the past decade and a half. And while the near-term price action may excite traders, the relative trend remains firmly pointed lower, underscoring the challenge of finding durable leadership in Chinese equities.
The technical takeaway: This year’s advance may be more of a bear market rally than a regime change. Until the Hang Seng can reclaim its 2021 highs and break the longer-term pattern of lower highs and lower lows, investors should remain skeptical of the sustainability of the move.
Momentum may carry prices higher in the short run, but the burden of proof is on the bulls. For now, China’s strength is real, but it lives within a bear market framework.
U.K. – Mind the (Momentum) Gap
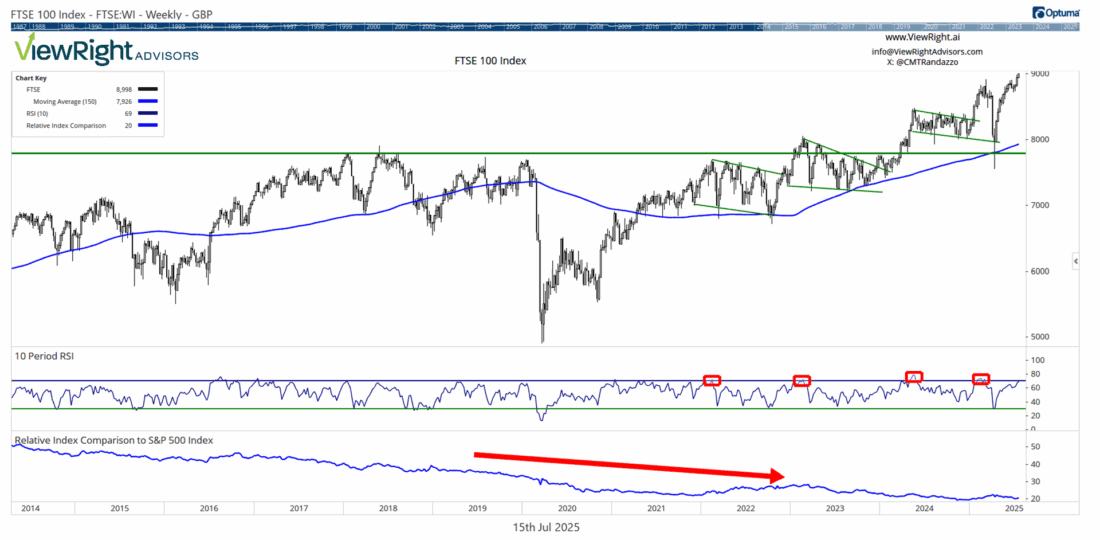
The U.K.’s FTSE 100 Index (UKX), which is comprised of the most highly capitalized blue-chip stocks listed on the London Stock Exchange, is often viewed as a proxy for the U.K. stock market. The index continues its quiet march higher in 2025, recently reaching fresh all-time highs—a notable feat, given its income-heavy profile and historical underperformance compared to global peers. Year-to-date gains remain strong—now outpacing the S&P 500—and the FTSE’s long-term structure continues to follow a reliable pattern of stair-step advances followed by orderly pauses, as depicted in the chart below.
Interestingly, over the past five years, FTSE consolidations have often ended with a successful test of its 150-week simple moving average (SMA), followed by another leg higher. Since breaking above this level in early 2021, the index hasn’t endured even one weekly close below this moving average. With the price now well extended above that moving average, investors should prepare for a possible breather.
Momentum indicators are also worth watching. The Relative Strength Index (RSI) is now approaching the 70 threshold from below. Historically, when the RSI crosses back down after exceeding 70, it has signaled the start of intermediate-term consolidations for the FTSE 100. That setup could be triggered again in the coming weeks if momentum accelerates further and then begins to fade.
From an actual relative strength perspective, the FTSE 100 remains in a long-term downtrend versus the S&P 500 Index, with underperformance dating back decades. While the U.K. benchmark has delivered positive absolute returns—and even some short-term outperformance—it has yet to prove itself as a durable alternative to U.S. equities from a leadership standpoint.
All indices are not created equal. One reason for the FTSE 100’s chronic underperformance versus the S&P 500 lies in its sector composition. The index is heavily tilted toward financials, energy, consumer staples, and health care—defensive and income-oriented sectors that tend to lag in growth-driven bull markets. In contrast, it has minimal exposure to technology, which has powered much of the S&P 500’s outperformance over the past decade. As long as global leadership remains concentrated in innovation and growth, the FTSE’s structural profile is likely to continue weighing on its relative returns.
The bottom line: While the FTSE’s uptrend is technically healthy and supported by long-term moving averages, past behavior and momentum readings suggest that a pause or pullback may be near. In a market that rewards discipline and timing, watching for RSI shifts and pullbacks toward trend support may offer a more favorable entry point than chasing fresh highs.
—
Originally posted 16th July 2025
Investopedia.com: The comments, opinions and analyses expressed herein are for informational purposes only and should not be considered individual investment advice or recommendations to invest in any security or to adopt any investment strategy. While we believe the information provided herein is reliable, we do not warrant its accuracy or completeness. The views and strategies described on our content may not be suitable for all investors. Because market and economic conditions are subject to rapid change, all comments, opinions and analyses contained within our content are rendered as of the date of the posting and may change without notice. The material is not intended as a complete analysis of every material fact regarding any country, region, market, industry, investment or strategy. This information is intended for US residents only.
Information posted on IBKR Campus that is provided by third-parties does NOT constitute a recommendation that you should contract for the services of that third party. Third-party participants who contribute to IBKR Campus are independent of Interactive Brokers and Interactive Brokers does not make any representations or warranties concerning the services offered, their past or future performance, or the accuracy of the information provided by the third party. Past performance is no guarantee of future results.
This material is from Investopedia and is being posted with its permission. The views expressed in this material are solely those of the author and/or Investopedia and Interactive Brokers is not endorsing or recommending any investment or trading discussed in the material. This material is not and should not be construed as an offer to buy or sell any security. It should not be construed as research or investment advice or a recommendation to buy, sell or hold any security or commodity. This material does not and is not intended to take into account the particular financial conditions, investment objectives or requirements of individual customers. Before acting on this material, you should consider whether it is suitable for your particular circumstances and, as necessary, seek professional advice.
Related Articles


Join The Conversation
For specific platform feedback and suggestions, please submit it directly to our team using these instructions.
If you have an account-specific question or concern, please reach out to Client Services.
We encourage you to look through our FAQs before posting. Your question may already be covered!