
- Solve real problems with our hands-on interface
- Progress from basic puts and calls to advanced strategies
Interactive Options Course

Posted July 7, 2025 at 10:45 am
The CBOE Volatility Index (VIX) measures the market’s expectation of volatility in the S&P 500 over the next 30 days, based on real-time option prices. Often called the “fear index,” the VIX reflects the cost investors are willing to pay for protection against future price swings.
But there’s more to it: the VIX is not just a barometer of fear—it’s one of the most powerful forward-looking tools to identify market turning points.
A low VIX (below 15) usually reflects investor complacency, typical of bull markets or the calm before a storm. A rising VIX indicates that traders expect turbulence ahead. But when the VIX explodes above 50, it tells us that investors are bracing for systemic crisis.
This is not a regular correction signal—it’s full-blown panic. And history shows that maximum panic tends to coincide with market bottoms. In that sense, VIX > 50 is one of the clearest contrarian indicators of an impending sentiment reversal.
Let’s be clear: the VIX has only broken above 50 three times in the past two decades. Each time, the S&P 500 was trading at or near its cyclical low:
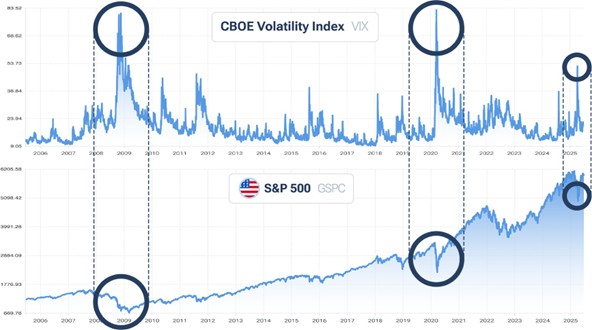
CBOE Volatility Index (VIX) peaks compared to seasonal lows of the S&P 500 (GSPC) – Source: Forecaster.biz
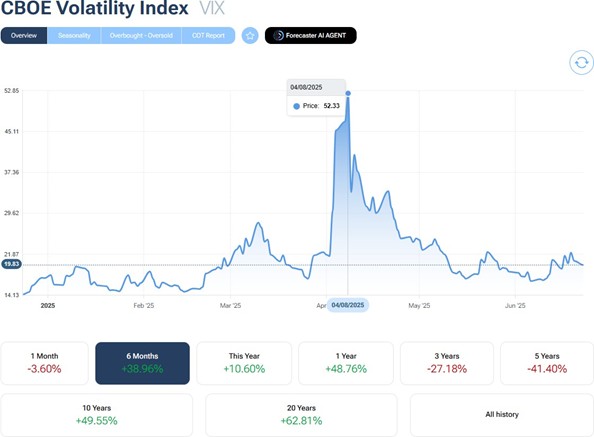
CBOE Volatility Index (VIX) April 2025 peak – Source: Forecaster.biz
In the first two cases, the break above 50, and following trend reversal confirmation under the 30’s level signaled a reduction in forced selling, peak margin calls, and indiscriminate liquidation. And in those cases, that capitulation laid the groundwork for a powerful bullish reversal. What can we expect from the current situation?
The VIX spiking to 50 signals maximum fear. But here’s what professionals really watch: the pullback from 50 to below 30. This shift often marks the transition from panic to accumulation, when markets begin to recover and upside momentum builds.
Why is this important? Because volatility tends to fall as confidence returns. That fall signals that:
Historically, the 50→30 VIX compression has acted as a confirmation trigger: a signal that bearish price action has reversed, and a new bullish phase is underway.
In 2009 and 2020, the VIX’s move below 30 coincided with the first higher highs on the S&P 500—a classic technical sign of trend reversal.
So where do we stand today?
This pattern mirrors 2009 and 2020. If the VIX continues to stand below the 30s, it would be a clear technical confirmation that a trend reversal is underway, with markets preparing to break out from the current range-bound, bullish bias.
The VIX doesn’t just tell us how afraid investors are, it helps us understand where we are in the emotional cycle of the market. Historically, VIX > 50 has been the sound of the bottom falling out but also the final scream before recovery.
And now, with volatility receding from panic levels, we may be witnessing the early stages of another powerful transition from uncertainty and weakness to accumulation and strength.
This is why we believe that a breakout from the current bearish environment is not only possible—it may be imminent.
For patient investors and alert traders, this is a time not for panic, but for positioning.
Information posted on IBKR Campus that is provided by third-parties does NOT constitute a recommendation that you should contract for the services of that third party. Third-party participants who contribute to IBKR Campus are independent of Interactive Brokers and Interactive Brokers does not make any representations or warranties concerning the services offered, their past or future performance, or the accuracy of the information provided by the third party. Past performance is no guarantee of future results.
This material is from Forecaster.biz and is being posted with its permission. The views expressed in this material are solely those of the author and/or Forecaster.biz and Interactive Brokers is not endorsing or recommending any investment or trading discussed in the material. This material is not and should not be construed as an offer to buy or sell any security. It should not be construed as research or investment advice or a recommendation to buy, sell or hold any security or commodity. This material does not and is not intended to take into account the particular financial conditions, investment objectives or requirements of individual customers. Before acting on this material, you should consider whether it is suitable for your particular circumstances and, as necessary, seek professional advice.
Options involve risk and are not suitable for all investors. For information on the uses and risks of options, you can obtain a copy of the Options Clearing Corporation risk disclosure document titled Characteristics and Risks of Standardized Options by going to the following link ibkr.com/occ. Multiple leg strategies, including spreads, will incur multiple transaction costs.
Related Articles


Join The Conversation
For specific platform feedback and suggestions, please submit it directly to our team using these instructions.
If you have an account-specific question or concern, please reach out to Client Services.
We encourage you to look through our FAQs before posting. Your question may already be covered!