
- Solve real problems with our hands-on interface
- Progress from basic puts and calls to advanced strategies
Interactive Options Course

Posted May 9, 2025 at 9:30 am
“Higher volatility alongside unreliable stock/bond correlation demands that investors think critically about diversification.”
Gargi Pal Chaudhuri – Chief Investment and Portfolio Strategist
We expect slower growth and higher inflation for the remainder of 2025. Instability in U.S. trade policy — even after the temporary reprieve granted to most countries — has increased the risk of a material slowdown in growth beyond the moderation we expected at the start of the year. Tariffs are likely to weigh on growth and boost near-term inflation, the extent of which will be determined by their size and stability. As BlackRock Investment Institute (BII) has laid out, “while persistent uncertainty can cause economic damage, we are seeing hard economic rules binding U.S. trade policy changes. The administration’s responsiveness to market moves and a recent de-escalation in rhetoric should bolster sentiment, but we believe a resolution will be needed to curb volatility. Looking further ahead, proposed tax cuts and a deregulatory agenda could prove stimulative to growth but are likely to further increase the budget deficit.
Given current data, we see the Fed on hold at least through the June meeting and likely beyond. Policy crosscurrents complicate the outlook. While trade policy risks curbing growth, immigration policy has the potential to reduce labor supply. In our view, the resulting wage pressure from a tighter labor market, combined with price pressure from ongoing tariffs could combine to delay or deter the cuts to the policy rate that slower growth would otherwise imply. The Fed may be able to reduce rates in the second half of the year — so long as longer-term inflation expectations remain contained. However, with possible tension between the two sides of their dual mandate, it may be that only a sharp slowdown would prompt the Fed to act.
So far, economic data has proven resilient and broadly consistent with our year-ahead outlook. Durable goods, retail sales, factory orders, nonfarm payrolls all have continued to exhibit the same strong-but-gradually-moderating trend as they have over the past year.1Corporate earnings growth likewise entered Q2 from a position of strength. So far, the Q1 earnings season is on track to beat consensus earnings expectations, though forward earnings forecasts have consistently been revised lower since tariffs were announced.2
Still, a whiff of recession has crept into ‘soft data’. Even before the global tariffs rollout, consumer sentiment readings from the University of Michigan survey and the Conference Board both showed consumer sentiment hitting multi-year lows.3 The NFIB and AAII sentiment readings showed a similar decline in confidence for small business owners and investors, respectively.4 Our own proprietary sentiment indicator — based on cash holdings, flows, leverage, credit spreads and breadth — was also steadily declining before diving in the week of the tariff announcements.5 Further instability of policy measures may continue to chip away at sentiment.
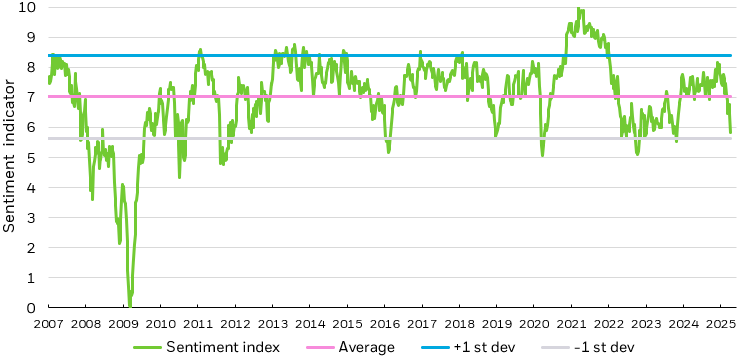
Source: BlackRock. Sentiment index equally weighted standardized scores of cash holdings, ETF flows, hedge fund leverage, high yield credit spreads, and equity market breadth. As of April 14, 2025.
Chart description: Line chart looking at investor sentiment from January 2007 to April 2025.
Overall, we see merit in defending against ongoing equity volatility while finding attractive entry points for enduring themes. We prioritize diversification in a structurally higher volatility environment in which U.S. Treasuries may not be the reliable diversifier they once were.
“We have been increasing our weighting in software and applications for months, as that is where the value of the ecosystem is starting to be captured. Relatively speaking, many companies in the sector are cheap. Earnings growth will remain solid, unless we go into recession.”
Tony Kim – Managing Director in Fundamental Equity
Our pre-tariff estimates point towards S&P 500 earnings growth of 8-10% for the full-year 2025, alongside a broadening out of earnings expectations away from the top of the index.6 However, we acknowledge that many earnings forecasts have yet to reflect the reality of a world newly defined by shifting trade policies. Our expectation for slower gross domestic product (GDP) growth could also translate to slower earnings growth, potentially exacerbated by price pressures on household real income. This could put further pressure on revenue expectations and corporate margins if businesses struggle to pass on costs in a slowing growth environment.
The near-term equity outlook remains unclear. Top-down analysis is complicated by high macro uncertainty, while bottom-up estimates are hampered by companies withdrawing forward guidance. Instead of specific price targets, we consider a range of earnings growth estimates against the backdrop of historically supported multiples. The wide range of earnings per share (EPS) forecasts makes an exact approximation of the current forward price to earnings ratio (P/E) difficult, though we feel that the current multiple is likely modestly above the long-term average. Above average index multiples, combined with slower growth expectations warrant a precise approach to equity allocations. However, we caution against extrapolating too much from valuations, as we find they are often a poor predictor of near-term returns. Rather than focus on a specific valuation, we feel investors should consider dynamic, systematic strategies that seek to respond quickly to changes in earnings expectations.
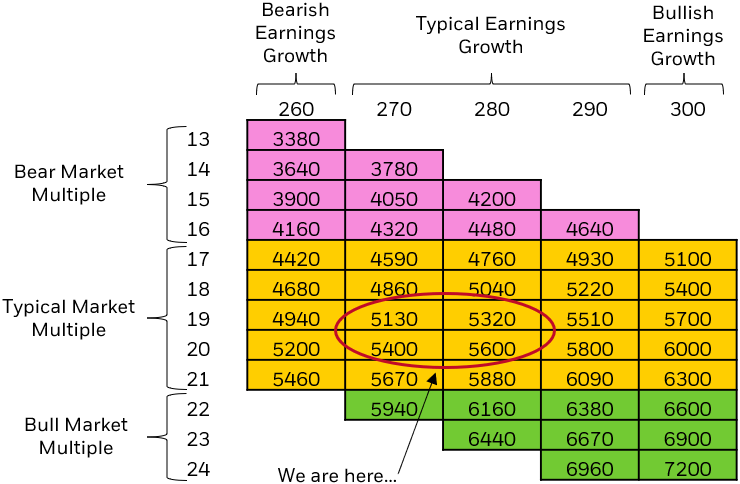
Source: BlackRock, Refinitiv. EPS range based on IBES 12-month forward EPS growth estimates for the S&P 500, with +/-1 standard deviation band defining the “Typical Earnings Growth” range based on 10-year earnings growth history. “Bearish” and “bullish” earnings growth estimates defined by less than (greater than) -1 standard deviation (+1sd). “Typical Market Multiple” range based on +/-1 standard deviation of 10-year market multiples. “Bear market” and “bull market” multiple defined by less than (greater than) -1 standard deviation (+1sd). As of April 14, 2025.
Chart description: Chart showcasing earnings estimates organized by recessionary multiples, typical market multiples, and bullish multiples.
Given the uncertainty and volatility of this backdrop we believe investors may be well served to modestly add to defensive exposures and look for attractive entry points to enduring themes.
The policy driven sell-off in April saw volatility spike dramatically. Although equities have partially recovered on subsequent policy changes, we don’t see volatility dissipating in a headline driven market. Regardless of the near-term direction of U.S. equities, structurally higher equity volatility has tended to make for lower risk-adjusted returns. For this reason, we believe investors — particularly those with shorter time horizons or lower risk tolerances — may be best suited looking to the low volatility factor to help filter out market turmoil. Because the factor offers an asymmetric up/down capture — participating to a greater degree on the upside than on the downside — it has historically, and over time, been able to deliver performance similar to the broad market with lower overall risk.7 In previous periods of low growth and higher inflation, the low volatility factor was able to meaningfully outperform other equity factors as well as the broad market.
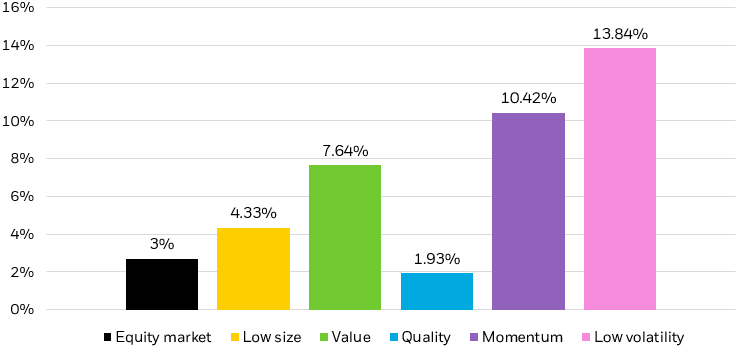
Source: Fama and French data libraries, the equity market is a value-weighted portfolio of all U.S. stocks from NYSE, AMEX, and NASDAQ used to calculate the market excess return over the risk-free rate. Size represented by SMB, Value by HML, Quality by RMW and Momentum by MOM in the Fama and French data set. Low Volatility represented by BAB in the AQR data set. SMB represents small minus big companies. HML represents high book-to-market minus low book-to-market companies, RMW represents robust operating profitability minus weak operating profitability companies. MOM represents high price momentum minus low price momentum companies. As of March 31, 2025. Performance does not reflect any management fees, transaction costs or expenses. Past performance does not guarantee future results.
Chart description: Bar chart depicting factor performance including equity, size, value, quality, momentum, and low volatility.
Alongside the low volatility factor, we evaluate historical correlations across both economic growth and inflation to find defensive industries that may help position equity portfolios from these shocks. We find that utilities and consumer staples have provided the least sensitivity to changes in both variables, while energy and technology were more exposed.8
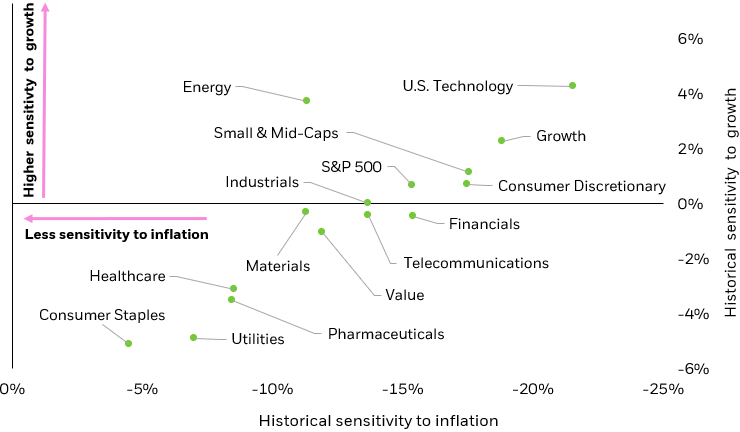
Source: BlackRock, Morningstar. Historical correlations based on daily correlations over the last 1-year period ending March 31, 2025. Inflation proxied by CPI, growth proxied by S&P 500 forward growth. Sector groupings determined by MSCI GICS Levels 1 groupings, Russell Smal & Mid-Cap, and Rusell 1000 Value & Growth indexes. As of March 31, 2025. Index performance is for illustrative purposes only. Index performance does not reflect any management fees, transaction costs, or expenses. Indexes are unmanaged and one cannot invest directly in an index. Past performance does not guarantee future results.
Chart description: Scatterplot displaying the growth and inflation sensitivities of various equity styles (value, growth, S&P 500, small & mid-caps) and sectors.
We extend this analysis beyond historical correlations by overlaying current valuations.While consumer staples have historically served as a defensive exposure, we find that the sector is currently trading at 21x earnings, above the broad market and its historical average, a more demanding setup that may represent already crowded positioning.9 Healthcare, another traditionally defensive sector, similarly trades at a premium to history.10 However, drilling beyond the sectoral level, we find defensive opportunities in Healthcare Providers, which trade at 13x forward earnings estimates, below the industry’s long-term average of 14x.11 Utilities also have screened relatively well and represent a sector overweight in many minimum volatility factor strategies.12
In our view, software’s structural AI advantage, combined with its resilience to potential tariffs, makes it one of the more compelling areas of the equity market.
A small handful of mega-cap companies have fueled the early stages of the AI buildout through the construction of large-scale AI datacenters. The primary beneficiaries of the buildout are the designers and manufacturers of AI chips & hardware.
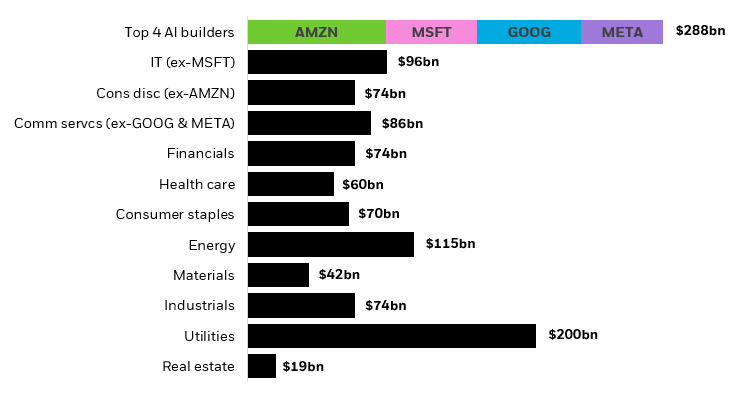
Source: Refinitiv, mean analyst estimate. Sector groupings determined by MSCI GICS Level 1 groupings. Specific companies or issuers are mentioned for educational purposes only and should not be deemed as a recommendation to buy or sell any securities. Any companies mentioned do not necessarily represent current or future holdings of any BlackRock products. For actual fund holdings, please visit the respective fund product pages. As of April 7, 2025.
Chart description: Bar graph demonstrating the top capex spenders of various sectors and Top 4 AI builders.
U.S. tariffs will accelerate the rewiring of globalization. Multi-aligned countries, like many in Latin America, stand poised to benefit relative to others from greater export competitiveness, trade diversification and increased investment flows.
Catherine Kress
Head of Geopolitical Research & Strategy
As U.S. equities declined amid Q1’s growth scare, international equities sharply outperformed, with the largest relative performance difference between European and U.S. indexes in two decades.15 International investments benefited from both strong local returns and a declining dollar, amplifying the returns realized by a U.S. investor.
While we still believe in the U.S.’s centrality in global capital markets and its track record of creating strong, innovative companies, developed markets ex-U.S. have shown a renewed focus on their own growth trajectories. From Europe’s push towards meaningful infrastructure and defense spending or Japan’s focus on creating shareholder value, the geopolitical fragmentation of today is accelerating this trend. BII stays positive on developed market (DM) stocks yet see more near-term volatility.
We believe increased uncertainty in the U.S. will continue to drive regional asset allocation decisions for foreign investors. The first months of 2025 brought some evidence that foreign investors had begun to repatriate investments away from the U.S. and back to home equity markets, a trend that could be a further tailwind to international performance should it continue.16 For many U.S. investors, looking abroad can offer the twin benefits of lower valuations and increased diversification. A weaker or rangebound U.S. dollar further adds to the favorable backdrop.
The U.S. has long benefited from its tilt to growth, one reason why it often supports higher valuations. Developed markets outside of the U.S. often offer higher exposure to the value factor — with higher dividend and earnings yield than their U.S. counterparts.17 By incorporating international equities into a diversified portfolio, investors may benefit from structural geopolitical trends while also balancing out the inherent growth bias within their U.S. equity allocations. We also see opportunity in actively managed international developed market strategies, with diverging tariff impacts and central bank bifurcation in some cases favoring selectivity.
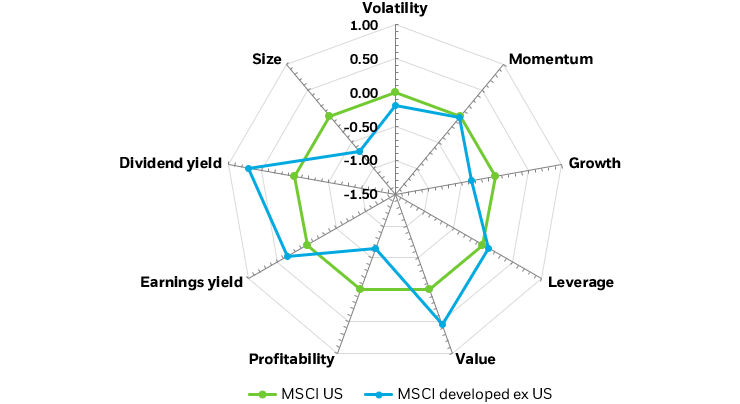
Source: BlackRock. Style factor chart using equity risk model. The numbers represent standardized scores on how many standard deviations away an exposure is from the estimation universe. As of April 14, 2025.
Chart description: Spider graph looking at exposures of different style factors including volatility, momentum, growth, leverage, value, profitability, earnings yield, dividend yield, and size.
We maintain a neutral outlook on emerging markets broadly — we watch for tailwinds from under-owned positioning and potential stimulus but acknowledge uncertainty will be the dominant catalyst of price action ahead. We believe China will continue to face the highest risk of trade volatility as a deliberate decoupling strategy currently remains central to the administration’s stated goals. Further, Q1 equity outperformance masked potential cracks in China’s macro backdrop, even before the administration’s tariff announcements. Growth in high-frequency indicators softened in late March, including steel demand and freight volume of departing ships at major ports, while consumer confidence remained at still-depressed levels.18
Rapidly changing policy and the continuation of the trade war are likely to weigh on China’s growth: we estimate U.S. tariffs covering 70% of Chinese exports add up to an estimated 2% drag on GDP. The trade war shows few signs of abating in the near-term as details remain unclear and uncertainty continues to metastasize. We therefore lean into emerging market minimum volatility strategies, which have seen a sizably lower downside capture relative to the broad index over the last 10 years.19
We believe Latin America may continue to grow its role as a strategically important trade partner as both the U.S. and China jockey for influence in the region. Latin American countries are critical producers and exporters of raw materials and agricultural products, ranging from copper and lithium to soybeans and beef.
The strategic importance of the region is underscored by both the U.S. and China’s investment presence. Although the U.S. still dominates in terms of bilateral trade, China is now the region’s second-largest trading partner, having grown bilateral trade to over $500 billion in recent years.20 As both the U.S. and China continue to push for influence in the region — particularly through strategic investments — we believe that Latin America may stand to benefit.
Further, valuations across LatAm equity markets are trading at substantial discounts relative to historical averages:
| Country | Price to earnings (P/E) | Price to book (P/B) | P/E 5Y Average | Prem/Disc to 5Y |
|---|---|---|---|---|
| Brazil | 7.5 | 1.6 | 8.6 | –13% |
| Mexico | 10.8 | 1.8 | 12.7 | –15% |
| Chile | 10.5 | 1.3 | 11.0 | –4% |
Source: BlackRock, Refinitiv. P/E and P/B country data from MSCI country indexes: MSCI Brazil, MSCI Mexico, and MSCI Chile. As of April 14, 2025.
“We continue to prioritize income in corporate credit and given the solid starting point of fundamentals, we are comfortable moving down in quality, selectively.“
Amanda Lynam, CPA – Head of Macro Credit Research
Rate volatility remains a key focus for financial markets. Rates on the long-end of the yield curve have risen steadily since the April 2nd tariff announcement, with 30-year nominal rates climbing 27 basis points and real 30-year rates popping 36 basis points.21 The dramatic move in the long-end of the curve has seen 10-year term premium push up to 10-year highs. Some of the move may be attributable to positioning and other temporary factors — the notable plunge in prime brokerage leverage data and the sharp move towards even more deeply negative swap spreads are consistent with the unwind of levered curve bets by hedge funds and other speculative actors. However, there are reasons to believe that long rates may continue to be volatile or even move higher, including a continued deterioration in the fiscal outlook. For this reason, we continue to favor exposure through the front-end and belly of the curve: maturities in the 3- to 7-year range.
Short-duration bonds remain a compelling tactical allocation. While the unwind of leveraged curve trades has sparked a sell-off on the long-end and a steepening of the yield curve, the front-end of the curve (0 to 5 years) has stayed elevated and relatively flat. We believe that income and carry look attractive on the front end of the Treasury curve as well as in select corporate credits and plus sectors. Elevated interest rate volatility often leads to pricing dislocations in the short end of the curve, which we believe can be opportunistically exploited through active management.
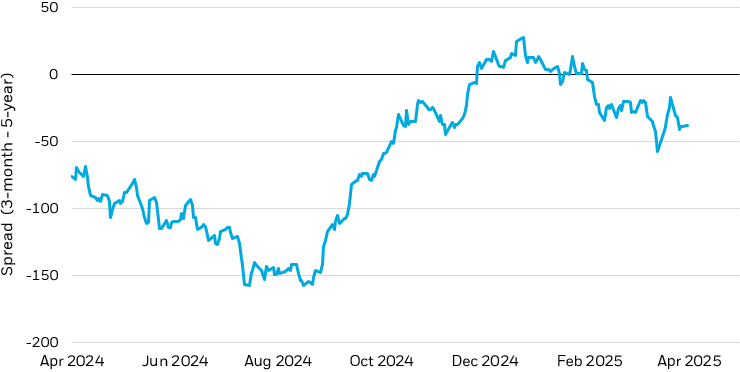
Source: Bloomberg. Spread between U.S. 3-month and 5-Year U.S. Treasury indexes shown. As of April 21, 2025. Index performance is for illustrative purposes only. Index performance does not reflect any management fees, transaction costs or expenses. Indexes are unmanaged and one cannot invest directly in an index. Past performance does not guarantee future results.
Chart description: Line graph demonstrating the spread between the U.S. 3-month and 5-year Treasury index.
We believe duration may be unreliable as a traditional ballast in the case of a growth shock.Firstly, it is our view that the FOMC won’t speedily cut rates with inflation above trend and tariffs shocking prices higher. Secondly, we believe that rising term premia and funding market dynamics will continue to fuel rate volatility in longer-duration assets. Finally, the fiscal uncertainty introduced by tax cuts may call the long-term creditworthiness of the U.S. into further question.
Global supply chains can evolve over time but cannot be rewired at speed without major disruption. Tariffs not only raise costs but can cut access to key inputs and potentially halt production. With the wholesale change to U.S. trade policy, inflation expectations have drifted higher. Currently, 2-year inflation breakevens (breakevens are market-implied inflation compensation over a particular period, in this case 2 years) are at some of the highest levels since the post-pandemic inflationary shock.22 Although we expect real yields to stay high, we think recent repricing higher in real rates have been overdone, and we favor inflation protection, particularly in the front-end of the curve.
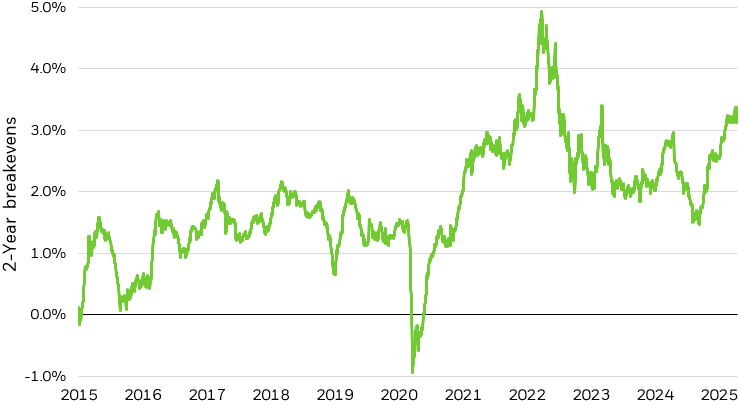
Source: Bloomberg. The U.S. Treasury 2-Year Breakeven Index, which reflects the market’s inflation expectations over the next two years by measuring the yield difference between 2 year Treasuries and 2 year TIPS, as of April 14, 2025.
Chart description: Line chart of the U.S. Treasury Yield 2-Year Breakeven Index from April 2015 to April 2025.
Today, the need couldn’t be greater for a better diversifier than traditional fixed income, as stagflation and global uncertainty pose an unprecedented challenge to the role of the dollar and U.S. Treasuries as portfolio diversifiers.
Jeffrey Rosenberg, CFA – Managing Director in Systematic Fixed Income
In our 2025 Year Ahead Investment Directions, we discussed how risk factors such as broad tariff implementations, curbed immigration policy, and mounting deficit concerns could impede the trajectory of solid economic growth in the U.S. The levels of extreme uncertainty that have battered the market since have demonstrated the importance of portfolio diversification amid unpredictable market swings. Crucially, we believe investors can benefit from a more deliberate diversification strategy, where traditional asset classes may not meet the moment.
In the past few years, elevated interest rates and low equity risk premiums had eroded the negative equity-bond correlation that benefited a 60-40 portfolio for decades. This challenge could linger in a world of rising macro uncertainty, reinforcing the importance of alternative sources for portfolio diversification.
In an environment of continued macro uncertainty, we believe gold could function as a viable alternative in investor portfolios. Our analysis shows that a small addition of gold in a portfolio could boost its Sharpe ratio for 1- year, 3- year, 5- year and 10- year time periods.23
Gold may also be used as a hedge against monetary debasement and fiat currency risks. Historically, government debt levels have shown a positive correlation with the price of gold.24Rising deficit levels across many developed economies, particularly in the U.S., have raised concerns about currency stability, making safe-haven assets like gold more attractive. (Learn more about U.S. deficit dynamics)
In addition, global central banks, which own nearly 20% of all physical gold ever mined, have significant influence on gold demand.25 Rising geopolitical uncertainty has prompted these institutions to bolster reserves, with Asian countries being particularly strong net buyers.26 We expect this trend to continue given the potential for them to diversify away from the U.S. dollar given more aggressive trade policies.
Besides gold, public and private infrastructure can also potentially bring portfolios diversification benefits. Over the past 17 years, public infrastructure has offered investors stable returns and a low correlation to other traditional asset classes, with added liquidity benefits compared to private infrastructure.27 In addition, long-term mega forces such as AI datacenter and sustainable transitions speak to the attractiveness of infrastructure as a strategic allocation for investors.
Cash can be another alternative asset class to consider in a highly volatile environment. Cash-like alternatives, such as short-term bonds, have typically been less sensitive to changes in interest rates and equity market uncertainty — consider, short-term bonds, on average, have had a lower correlation to stocks.28
Cash-like strategies diversify portfolios away from near-term ups and downs by seeking to preserve capital. By parking cash in a lower risk asset, investors can later deploy it in places that may be attractive when market conditions support.
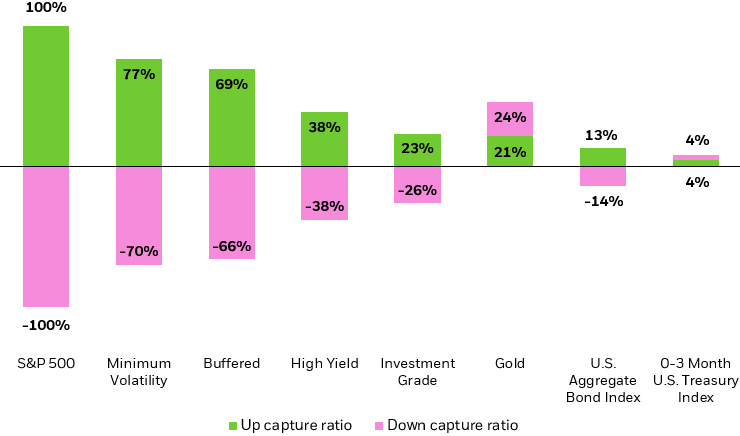
Source: Morningstar. Stocks as represented by S&P 500 Index; Min Vol as represented by MSCI USA Minimum Volatility Index; Buffered as represented by CBOE S&P 500 95-110 Collar Index; HY as represented by ICE BofA U.S. HY Index; IG as represented by ICE BofA U.S. Corporate Index; Gold as represented by LBMA Gold Price Index; Bonds as represented by Bloomberg US Aggregate Bond Index; Equity Market Neutral represented by the average performance across 40 funds in the U.S. Fund Equity Market Neutral Morningstar Category. From April 1, 2015 to March 31, 2025. The up/down capture ratio, which refers to beta capture, shows how much a strategy tends to rise when the market goes up and how much it tends to fall when the market goes down. Past performance does not guarantee or indicate future results. Index performance is shown for illustrative purposes only. It is not possible to invest directly in an index.
Chart description: Bar chart illustrating the up capture ratio and down capture ratio various investment strategies and asset classes.
—
Originally Posted on April 28, 2025 – 2025 Spring Investment Directions: Exposures for volatile markets
The iShares Trusts are not investment companies registered under the Investment Company Act of 1940, and therefore are not subject to the same regulatory requirements as mutual funds or ETFs registered under the Investment Company Act of 1940. Investments in these products are speculative and involve a high degree of risk.
The iShares Funds are distributed by BlackRock Investments, LLC (together with its affiliates, “BlackRock”).
The iShares Funds are not sponsored, endorsed, issued, sold or promoted by Markit Indices Limited, nor does this company make any representation regarding the advisability of investing in the Funds. BlackRock is not affiliated with Markit Indices Limited.
©2022 BlackRock, Inc. All rights reserved. iSHARES and BLACKROCK are registered trademarks of BlackRock, Inc., or its subsidiaries in the United States and elsewhere. All other marks are the property of their respective owners.
Information posted on IBKR Campus that is provided by third-parties does NOT constitute a recommendation that you should contract for the services of that third party. Third-party participants who contribute to IBKR Campus are independent of Interactive Brokers and Interactive Brokers does not make any representations or warranties concerning the services offered, their past or future performance, or the accuracy of the information provided by the third party. Past performance is no guarantee of future results.
This material is from iShares by BlackRock and is being posted with its permission. The views expressed in this material are solely those of the author and/or iShares by BlackRock and Interactive Brokers is not endorsing or recommending any investment or trading discussed in the material. This material is not and should not be construed as an offer to buy or sell any security. It should not be construed as research or investment advice or a recommendation to buy, sell or hold any security or commodity. This material does not and is not intended to take into account the particular financial conditions, investment objectives or requirements of individual customers. Before acting on this material, you should consider whether it is suitable for your particular circumstances and, as necessary, seek professional advice.
Related Articles


Join The Conversation
For specific platform feedback and suggestions, please submit it directly to our team using these instructions.
If you have an account-specific question or concern, please reach out to Client Services.
We encourage you to look through our FAQs before posting. Your question may already be covered!