
- Solve real problems with our hands-on interface
- Progress from basic puts and calls to advanced strategies
Interactive Options Course
Posted June 7, 2024 at 9:29 am
Investopedia is partnering with CMT Association on this newsletter. The contents of this newsletter are for informational and educational purposes only, however, and do not constitute investing advice. The guest authors, which may sell research to investors, and may trade or hold positions in securities mentioned herein do not represent the views of CMT Association or Investopedia. Please consult a financial advisor for investment recommendations and services.
The Volume Profile Indicator
When a technical analyst evaluates a price chart, he or she will identify horizontal levels of supply (resistance) and demand (support). These levels will help the analyst determine trend, manage risk, and develop a complete view of the asset. One way to confirm if a price level is important and holds price memory, is to apply the volume profile indicator (VPI). Unlike traditional volume, which provides a temporal view of the asset’s relationship with volume, VPI ignores timeframe and reviews volume at specific price levels. In other words, instead of identifying the total volume of stock XYZ on this specific day, week or month, VPI tells us at what price the volume occurred. For this reason, VPI is presented as a horizontal histogram. The thought is that if a large number of shares are exchanging hands at a certain level, it is more likely this level holds true price memory and will behave as support/resistance.
The VPI level with the highest volume is referred to as the point of control (POC). The POC can be used to help confirm support/resistance levels. For example, the below chart highlights a liquid market index fund with a volume profile running from the October ’22 low to the Summer ’23 high. The POC confirmed the support/resistance zone ~$410 per share. Months later the asset successfully tested this support zone and witnessed demand bid prices higher.

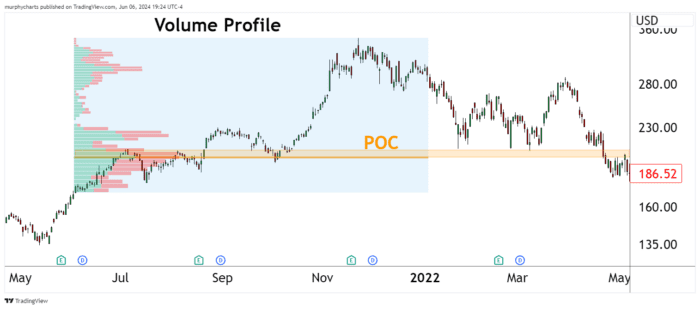
VPI not only helps us identify support/resistance zones, but it can also aid our understanding of trend. When the POC is near the lower end of the profile amid what appears to be a healthy uptrend, we should reevaluate and ask ourselves why is volume declining at higher price levels? The below is a great example of an asset appearing to be in a strong uptrend, but the volume profile is not confirming the move higher. Eventually, price finds its way back to the POC and retests this level several times before breaking down.

The volume profile indicator provides a unique way to analyze supply and demand. Its application can vary depending on the asset or the analyst, but it remains an important tool in the technical analyst’s toolkit.
About This Week’s Author
Shane Murphy, CMT has been a CMT Charterholder since 2022. He is currently a Wealth Management Associate at Michael Roberts Associates, Inc. where he assists in portfolio construction, investment research, and financial planning.
——–
Originally posted on June 7th, 2024
For specific platform feedback and suggestions, please submit it directly to our team using these instructions.
If you have an account-specific question or concern, please reach out to Client Services.
We encourage you to look through our FAQs before posting. Your question may already be covered!
Investopedia.com: The comments, opinions and analyses expressed herein are for informational purposes only and should not be considered individual investment advice or recommendations to invest in any security or to adopt any investment strategy. While we believe the information provided herein is reliable, we do not warrant its accuracy or completeness. The views and strategies described on our content may not be suitable for all investors. Because market and economic conditions are subject to rapid change, all comments, opinions and analyses contained within our content are rendered as of the date of the posting and may change without notice. The material is not intended as a complete analysis of every material fact regarding any country, region, market, industry, investment or strategy. This information is intended for US residents only.
Information posted on IBKR Campus that is provided by third-parties does NOT constitute a recommendation that you should contract for the services of that third party. Third-party participants who contribute to IBKR Campus are independent of Interactive Brokers and Interactive Brokers does not make any representations or warranties concerning the services offered, their past or future performance, or the accuracy of the information provided by the third party. Past performance is no guarantee of future results.
This material is from Investopedia and is being posted with its permission. The views expressed in this material are solely those of the author and/or Investopedia and Interactive Brokers is not endorsing or recommending any investment or trading discussed in the material. This material is not and should not be construed as an offer to buy or sell any security. It should not be construed as research or investment advice or a recommendation to buy, sell or hold any security or commodity. This material does not and is not intended to take into account the particular financial conditions, investment objectives or requirements of individual customers. Before acting on this material, you should consider whether it is suitable for your particular circumstances and, as necessary, seek professional advice.


Very interesting information however IBKR doesnt offer this indicator as an option on their charts (hahaha) So it seems like a moot point training people about something you dont offer as a service and have to go else where to get. something to consider perhaps?! cheers
Hello, thank you for reaching out and we apologize for the delayed response. Please view this link for more information about IBKR’s available chart indicators: https://www.interactivebrokers.com/en/software/mobileTWS/analyze/chart-indicators.htm
We hope this helps!
Unfortunately your link posted leads to the empty(!) user guide page. Could you please share a little more details? Thanks in advance.
Hello again, we apologize for the delayed response. You can view the chart indicators here. We hope this helps!
For anyone looking to use the volume profile in TWS, I figured out how to get it on my charts in TWS. While it isn’t intuitive, open IBKR desktop in live mode and add it to your chart and then sign out. Once you sign into TWS again, it should be available on the chart. Definitely very odd that they haven’t added it as an available indicator in TWS, but for some reason it becomes available if you set it as an indicator in IBKR desktop first. Hope that works for you.
Unfortunately, even in the live mode on the web portal I do not see it. Can you please specify?
To be honest, I can’t see how a day trader can trade with out using volume profile. It identifies the high probability trades.
Jesse Livermore used the time element with his pivot point trading. Volume profile gives you a way to see the time element. I don’t know why IBKR does not have volume profile added to the indicators. Think or Swim has it. And you can break of the time element by Hour, days, etc. I can’t trade without using the time element to my trading.
Ok, months go, still can’t see this indicator available. I would definitely use it if it was. Where the screenshot in the article comes from?
Trading view
you have to use TradingView to get a good Volume Profile. Unfortunately IBKR is not a good charting platform
Thank you for sharing and we are sorry to hear this. If you have a specific suggestion(s) on how we can improve, we would like to hear it! Please review this FAQ on where you can leave your feedback: https://www.ibkr.com/faq?id=32653353
You can also post in the Feature Poll in Client Portal where other IBKR users can comment and vote: https://portal.interactivebrokers.com/portal/#/suggestions
why is the Volume Profile visible on advance Charts on IBKR Desktop and not on TWS? please add the same indicators to TWS.
Hello, thank you for reaching out. To display Volume on a chart in TWS: https://www.interactivebrokers.com/faq?id=35808516
For all of the chart indicators in TWS, please view: https://www.ibkrguides.com/traderworkstation/chart-indicators.htm
For more information on the Advanced Charts, please view: https://www.ibkrguides.com/traderworkstation/advanced-chart.htm
We hope this helps!
Why IB don’t add volume profile feature?
Hi, thank you for reaching out. Please troubleshoot using the instructions in this FAQ: https://www.interactivebrokers.com/faq?id=42711884
Please reach back out with any additional questions. We are here to help!
The support at IB is terrible and it is getting worse every day, what a shame, they are ignorant, they put you on hold and forget about you.
Hello, thank you for reaching out. We are sorry to hear that your experience was not what you expected. We have invested in customer service to significantly reduce our wait times and to provide fast assistance to our clients. We have Client Services Teams across the globe which can be reached by web ticket: https://spr.ly/IBKR_TicketCampus
We are also happy to answer general questions here. We would appreciate the opportunity to turn your experience around.
There is a Volume histogram available in IB TWS. Not too sure if that is the same are Volume profile indicator. This is accessible via the “View” menu of the chart windows in question. Or you can go to chart settings and it’s under “Additional Data and Features”. It brings out a Horizontal Histogram to the right of the chart. Would appreciated if someone can comment if that’s the same are Volume profile indication.
the best thing i found was the Volume Profile Visible Range aka VPVR
Seriously disappointing that a brokerage of this caliber and size does not do a “Volume profile”. Come on IB get with it!!!
Hi Jay, thank you for reaching out. Can you please describe what you are looking for in more detail? For instructions to view volume on a chart in TWS: https://www.interactivebrokers.com/faq?id=35808516
For specific suggestion(s) on how we can improve, we would like to hear it! Please review this FAQ on where you can leave your feedback: https://www.ibkr.com/faq?id=32653353
Is volume profile data affected by market data subscription? I.e. if you don’t have market data active, will it be less accurate?