The TWS Risk Navigator is a powerful tool and can be used to calculate the likely forward price of single options and option combinations. In this video we will go through how to use the Risk Navigator what-if custom scenario feature to make assumptions on the forward price of an underlying and implied volatility to measure the potential price of an option and combination on various days leading up to expiration.

Let us start by going to a Watchlist I previously created with options and combinations on it.
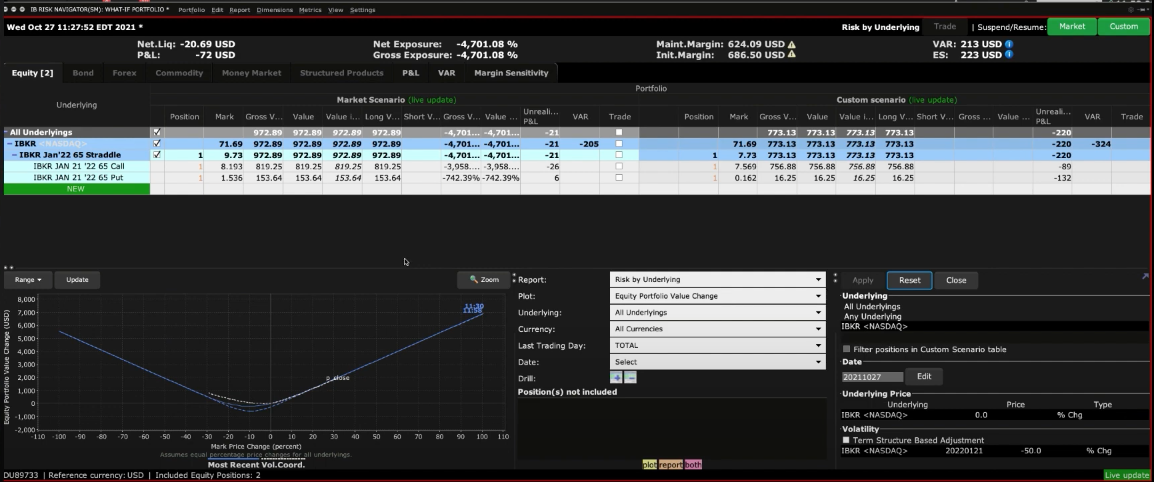
To bring up a new Risk Navigator What If right-click on an option and scroll down to display What-if. A Risk Navigator What-if display will populate with just this single option. Notice that the border of the Risk Navigator is Red indicating it is in edit mode.
To access available columns, go to the Metrics Menus. Scroll down to see available column areas. Choose the metrics you want, and the available columns will show.
I recommend adding in the following position risk columns: Delta, Delta Dollars, Gamma, Vega, and Theta if they are not already selected. You are now displaying market prices and associated values.

We will now bring up the custom scenario by going to the view menu at the top of the screen and scrolling down to custom scenario. This will replicate the market scenario with a custom scenario on the right of the screen.

You can adjust the underlying price, the option volatility for the expiration, and even set a final settlement price. Let’s walk through a few scenarios to see how they affect the price of the option.
I have selected a long call option for our first example.
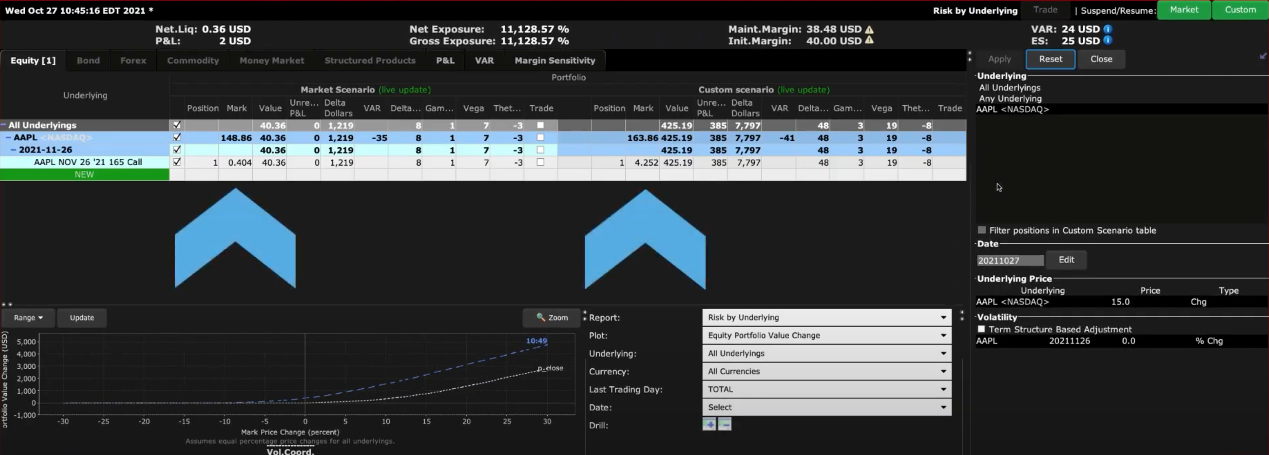
The aim here is to learn the premium of the option by first increasing the price of the underlying by $15 and second, reducing the reading for implied volatility by 15%.
Let’s first adjust the underlying price.
There are 3 choices: Explicit Value, Change, or Percent Change. We will increase the underlying price by typing $15 into the box underneath price, changing the type to “chng”. Note that whenever you edit any inputs here, the font will remain red until you apply the change. Click “Apply”.
The value of the option has increased reflecting the change in the underlying. This can be seen in both the data table and the plot. I’ll now reset the scenario editor and adjust the volatility by lowering it 15% to show the effect on the option pricing. You can now see how the premium of the option has declined for a reduction in implied volatility.

We will now go through some examples using a strangle combination. From the Watchlist we created click on a strangle. We can choose to either add it to the existing What if that is open or open an entirely new one just for the combination. We will open a new one. I’ll make some exaggerated adjustments to emphasize the changes and point them out on both the plot and the table.
Examples using Strangle Combination
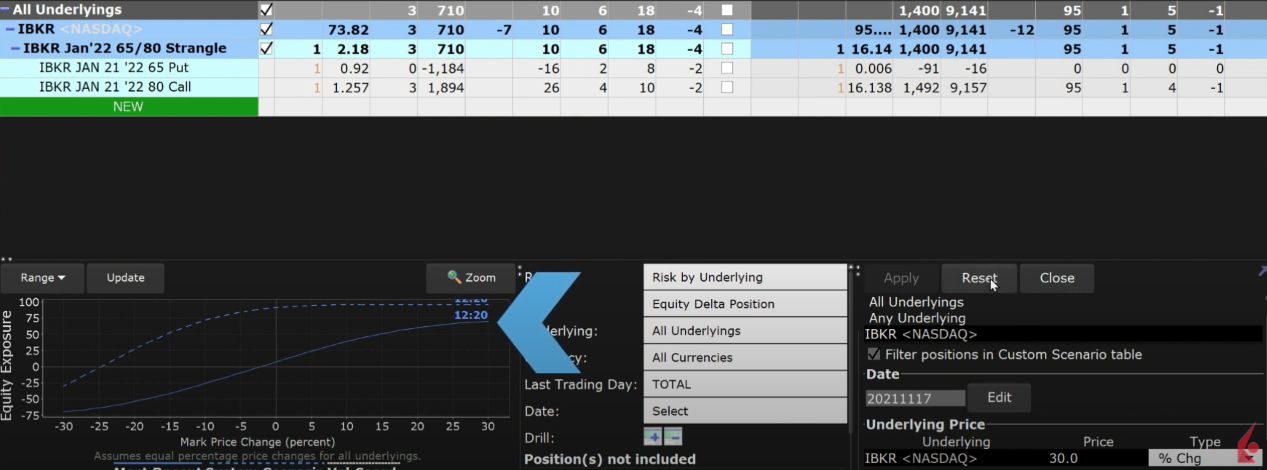
- Let’s increase the price by 30%. Under type I can choose percent, change, or explicit value. I’ll now hit apply. In the table compare the market and custom premiums. You can see the price of the call increased while the value of the put decreased. Looking at the delta you can see that the call delta increased and the put delta decreased.

Looking at the plot I’ll change to Equity Portfolio Value and then equity delta position. Notice the dotted blue line which is the scenario versus the solid blue line, which is the solid blue line which is the most recent market scenario.

I’ll now reset the price change to zero and adjust the volatility by decreasing it by 50%. Notice now how the price of both the call and the put have decreased drastically from their original value.
- I’ll now reset the vol change and move the date up to the day before expiration to show how it effects the pricing and Greeks. Both call options above the price of the underlying and put options below the price of the underlying lose value faster as expiration approaches since neither has intrinsic value.
- Let’s now fast forward beyond expiration in order to illustrate what happens when the long call option in the strangle ends in-the-money. So we have three variables to adjust.
- Let’s enter a date from the calendar a few days after expiration
- Let’s assume that the share price was greater than the strike price for the call at expiration by adjusting the final settlement price at the bottom
- Let’s further assume that the current share price continued to rise and is above the price at the time of expiration.
- I’ll now click apply.
Notice that now the Risk Navigator under the custom scenario is showing a stock position of 100 shares, but there are no longer any option positions. The custom scenario also updates to reflect the chosen risk metrics.

As you can see the Risk Navigator is a powerful tool enabling you to test various scenarios for price, time and volatility to display their impact on the worth of an option. Use the custom scenario functionality to test your trading strategies and learn how to monitor risk through the lens of Greek variables.


Can I roll options via Risk Navigator?
Thank you for asking. This is not possible. The Risk Navigator is a real-time market-risk management platform that provides a comprehensive measure of risk exposure across multiple asset classes around the globe.Its easy-to-read spreadsheet-like interface lets you quickly identify exposure to risk starting at the portfolio level, with drill-down access into successively deeper levels of detail within multiple report views. For more information on the Risk Navigator, please view this User Guide: https://www.ibkrguides.com/traderworkstation/risk-navigator.htm?Highlight=Risk%20Navigator
For instructions to roll options, please view this FAQ: https://www.interactivebrokers.com/faq?id=34483816
We hope this helps!