
- Solve real problems with our hands-on interface
- Progress from basic puts and calls to advanced strategies
Interactive Options Course

Posted August 6, 2025 at 10:45 am
After a strong first half of the year, it’s time to take a step back and analyze the S&P 500 from multiple perspectives. In this article, I conduct a comprehensive review of the index, combining fundamental valuation, positioning data from institutional investors, seasonal trends, and proprietary indicators. The result is a nuanced view of where we stand and what to expect in the months ahead.
The first lens through which we examine the S&P 500 is earnings. Historically, price movements tend to follow the path of corporate profits—and right now, earnings are booming. The S&P 500 has reached an all-time high in total earnings, exceeding $2.3 trillion, up from $1.81 trillion in 2024. This surge is largely driven by the tech giants, who continue to outperform expectations.

Earnings drive the market: The S&P 500 has hit a record $2.3 trillion in total net income, up sharply from $1.81 trillion in 2024. – Source: Forecaster Terminal
Revenue growth is also robust, jumping from $16.4 trillion to over $25 trillion. Interestingly, in the long run, revenue sometimes aligns even more closely with index prices than earnings do. With fundamentals this strong, it’s no surprise to see the S&P 500 near historical highs.
After months of being clearly undervalued—at times more than 10%—the S&P 500 is now nearing fair value. According to our weighted fair value model, the index is currently undervalued by just 2.91%. From an investor psychology standpoint, this level often triggers a shift: institutions start to exercise more caution, knowing that gains have accumulated and risks (however small) could prompt swift profit-taking.
While fundamentals remain excellent, this proximity to fair value suggests that we’re moving into more sensitive territory. Any external shock could prompt significant volatility.
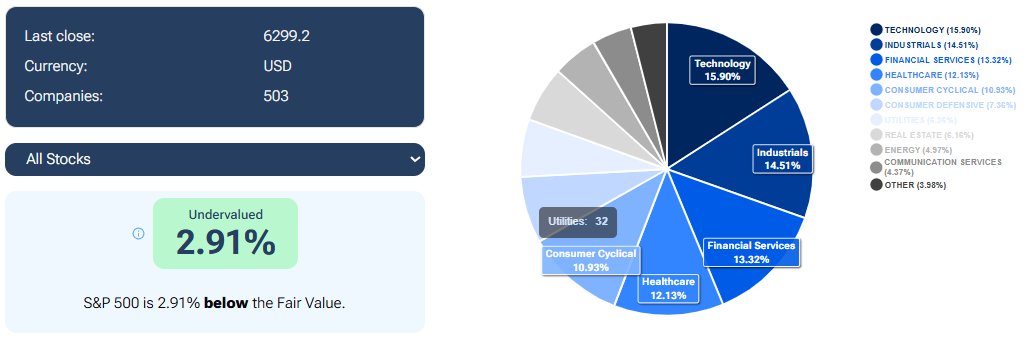
Approaching equilibrium: With the S&P 500 now just 2.91% below its fair value, the index enters a psychologically sensitive zone for investors. – Source: Forecaster Terminal
Looking at the Commitment of Traders (COT) data offers insight into how major players are positioned.

COT data shows institutional investors maintaining long positions at levels similar to early 2025, even as prices rise. – Source: Forecaster Terminal
This latent short positioning could act as a bullish catalyst if hedge funds are forced to cover, triggering an acceleration to the upside.
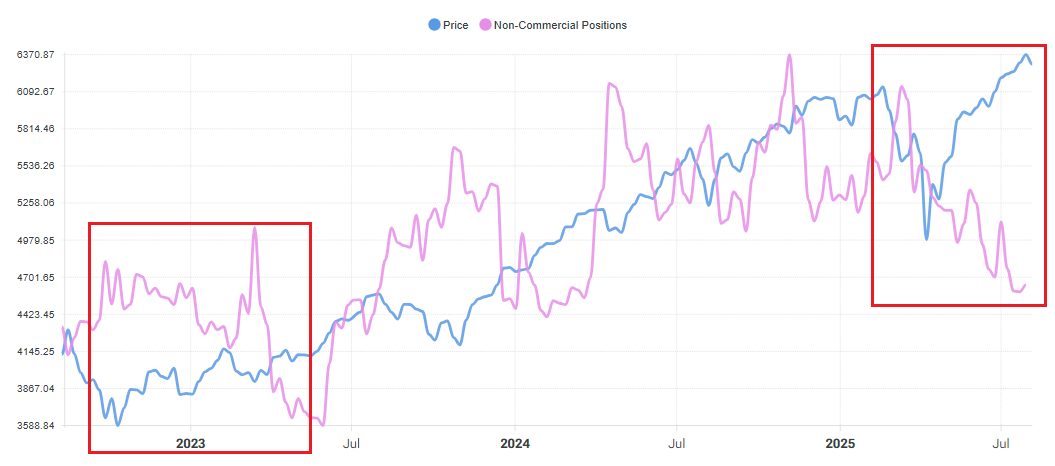
Non-commercial traders remain skeptical, maintaining net short positions even as the S&P 500 hits new highs. A similar setup in 2023 led to a short-covering surge—suggesting latent upside potential if speculative investors are once again caught off guard. – Source: Forecaster Terminal
Overlaying seasonality models on the S&P 500 reveals a pattern worth noting. The index tends to underperform from mid-August through September. Over the last 15 years, the probability of a negative return during this window is about 55%, with an average drawdown of -6%.
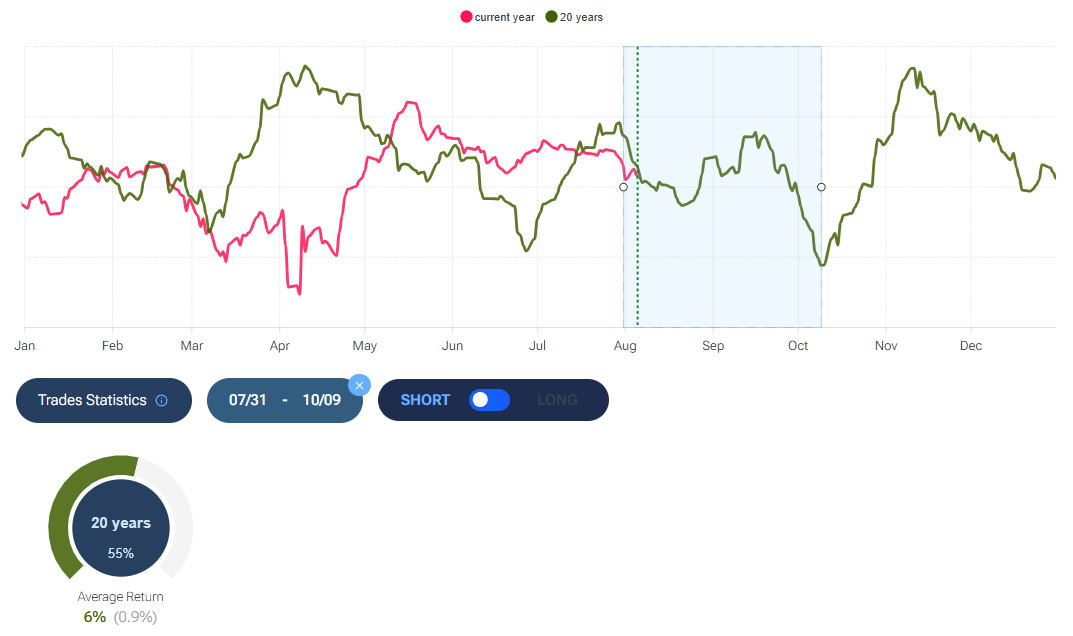
Historical patterns suggest the S&P 500 typically underperforms from mid-August to early October. – Source: Forecaster Terminal
While not dramatic, this seasonally weak period supports the idea of protecting gains or rebalancing. In my case, I’ve taken profits on several positions and increased exposure only to those names I believe have long-term upside—despite short-term volatility.
The S&P 500 is fundamentally sound but technically stretched. Institutional investors are cautious, seasonality is mildly bearish, and speculative funds are positioned for downside—creating a setup where any upside surprise could lead to a sharp rally.In the meantime, I’ve adjusted my portfolio to lock in gains, protect against near-term volatility, and stay exposed to names
—
Originally Posted on August 6, 2025
Information posted on IBKR Campus that is provided by third-parties does NOT constitute a recommendation that you should contract for the services of that third party. Third-party participants who contribute to IBKR Campus are independent of Interactive Brokers and Interactive Brokers does not make any representations or warranties concerning the services offered, their past or future performance, or the accuracy of the information provided by the third party. Past performance is no guarantee of future results.
This material is from Forecaster.biz and is being posted with its permission. The views expressed in this material are solely those of the author and/or Forecaster.biz and Interactive Brokers is not endorsing or recommending any investment or trading discussed in the material. This material is not and should not be construed as an offer to buy or sell any security. It should not be construed as research or investment advice or a recommendation to buy, sell or hold any security or commodity. This material does not and is not intended to take into account the particular financial conditions, investment objectives or requirements of individual customers. Before acting on this material, you should consider whether it is suitable for your particular circumstances and, as necessary, seek professional advice.
Related Articles


")


Join The Conversation
For specific platform feedback and suggestions, please submit it directly to our team using these instructions.
If you have an account-specific question or concern, please reach out to Client Services.
We encourage you to look through our FAQs before posting. Your question may already be covered!