
- Solve real problems with our hands-on interface
- Progress from basic puts and calls to advanced strategies
Interactive Options Course

Posted May 5, 2026 at 11:44 am
The article “Should Your Mom Have Private Equity in Her 401K?” was originally published on Alpha Architect blog.
Private equity has long been marketed as the golden ticket. Higher returns. Exclusive access. Institutional-grade investing. The pitch now is simple. Bring it to retail portfolios, including 401(k)s. Critics argue that once you account for fees, illiquidity, and realistic fund selection, much of that advantage disappears. This paper pushes back on the narrative. It shows that for most investors, private equity may not deliver the promised edge. And more importantly, it proposes a simpler, more liquid way to access the same economic exposure.
Private equity outperformance is less reliable than advertised
While top-quartile PE funds historically outperformed public markets, persistence has largely disappeared. Selecting future winners is extremely difficult. Most investors are likely to earn median returns rather than the headline top-tier outcomes.
Recent performance shows little to no alpha versus public markets
When using more realistic methodologies that align cash flows between PE and public benchmarks, excess returns largely vanish. Over the past 15 years, private equity has delivered close to zero or even negative alpha relative to the S&P 500.
Fees materially erode returns, especially for retail investors
Institutional PE returns are already net of significant fees. Retail access layers on additional costs from wealth managers, fund-of-funds structures, and distribution channels. These extra fees can meaningfully dilute returns, often by double-digit percentages annually.
Fund-of-funds structures significantly underperform
A common access route for retail investors is through intermediaries. Historically, these structures have delivered persistent underperformance relative to both direct PE investments and public markets, largely due to fees and allocation inefficiencies.
Liquidity risk is real and often misunderstood
Private equity investments can lock capital for 10–15 years. While some products promise periodic liquidity, redemption can disappear during market stress. Retail investors, unlike institutions, face real-life liquidity needs that make this constraint more problematic.
Industry dynamics suggest future returns may be lower
The PE industry has grown dramatically, with trillions in assets and large amounts of uninvested capital. High entry valuations and slower exits create headwinds for future returns, making historical performance less relevant going forward.
Publicly listed PE firms may offer a better
A basket of publicly traded PE firms has historically outperformed their own flagship private funds over 5- and 10-year horizons. This approach provides similar economic exposure with lower costs and full liquidity
Focus on implementation, not just asset class labels
The question is not whether private equity is attractive in theory. It is whether clients can access it efficiently. In most cases, implementation costs and constraints dominate the outcome.
Be skeptical of “democratization” narratives
Retail access often comes with additional layers of fees and complexity. What looks like inclusion may actually be value transfer from investors to intermediaries.
Prioritize liquidity as a core portfolio feature
Individual investors face unpredictable cash needs. Avoid locking significant portions of portfolios into illiquid structures unless there is a clear and compelling payoff.
Consider listed alternatives for exposure
Publicly traded PE firms provide exposure to the economics of private markets without the operational burden. This can replicate many benefits while avoiding key drawbacks.
Control fees aggressively
Fees compound just like returns. A 1–2% additional annual cost can erase most of the expected excess return from private equity.
“Private equity is often presented as a way to earn higher returns, but the reality is more nuanced. Once you account for fees, limited liquidity, and the difficulty of selecting top-performing funds, the advantage becomes much less clear. In many cases, investors may be better off gaining exposure through simpler, more liquid public investments that capture similar economic benefits without the added complexity”
The S&P returns generated during the same time periods are shown in Figure 1. The reported Horizon PE IRR returns outperformed the S&P in each of the respective time increments. These are the numbers that PE proponents have used to justify PE capital allocations. However, these comparisons are flawed in that IRRs and TWRs are calculated very differently, and the cash flow timing has a material impact on IRR results. The Horizon IRRs above, in essence, “lump” each of the vintage years into one pool and assume quarterly inflows and outflows of capital. This is unrealistic given that PE capital calls and distributions occur throughout the year.
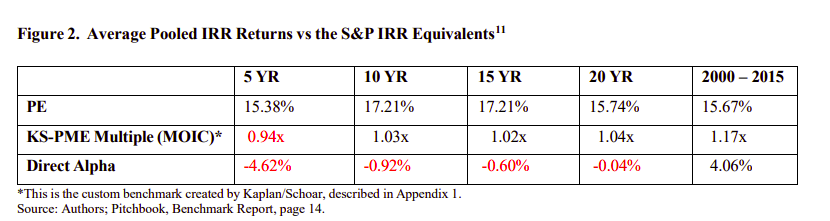
For Figure 2: Pitchbook undertook a more sophisticated analysis of PE performance versus the public market. First, they created “Pooled IRRs” by vintage year which reflect the actual cash flows of all the funds in the pool when they occurred as opposed to the simplistic assumption of treating all cash flows as though they occurred quarterly or annually. Then, they created a better comparison to the S&P, assuming analogous cash flows into the S&P matching those of the Pooled IRRs.10 This analysis generated a return multiple on invested capital (MOIC) at the end of the time period. In effect, Pitchbook created an IRR to IRR comparison of PE and the S&P. Lastly, Pitchbook then calculated the Direct Alpha (positive or negative) of the vintage year Pooled IRR relative to the S&P. A score above 1 indicates outperformance and a score below 1 indicates underperformance relative to the S&P.
The annual performance results of each vintage year for the past 23 years are shown in Exhibit 2. This methodology suggests very different conclusions than those in Figure 1.

The results are hypothetical results and are NOT an indicator of future results and do NOT represent returns that any investor actually attained. Indexes are unmanaged and do not reflect management or trading fees, and one cannot invest directly in an index.
This paper examines whether private equity investments should be included in retail retirement portfolios such as 401Ks. While proponents argue that private equity offers higher returns and access to a broader investment universe, the analysis challenges these claims. Evidence suggests that performance persistence has declined, excess returns relative to public markets have diminished, and additional layers of fees significantly reduce outcomes for retail investors. Given liquidity constraints and implementation challenges, the paper proposes an alternative approach: gaining exposure through publicly traded private equity firms, which may offer superior returns, lower costs, and greater flexibility.
The views and opinions expressed herein are those of the author and do not necessarily reflect the views of Alpha Architect, its affiliates or its employees. Our full disclosures are available here. Definitions of common statistics used in our analysis are available here (towards the bottom).
This site provides NO information on our value ETFs or our momentum ETFs. Please refer to this site.
Information posted on IBKR Campus that is provided by third-parties does NOT constitute a recommendation that you should contract for the services of that third party. Third-party participants who contribute to IBKR Campus are independent of Interactive Brokers and Interactive Brokers does not make any representations or warranties concerning the services offered, their past or future performance, or the accuracy of the information provided by the third party. Past performance is no guarantee of future results.
This material is from Alpha Architect and is being posted with its permission. The views expressed in this material are solely those of the author and/or Alpha Architect and Interactive Brokers is not endorsing or recommending any investment or trading discussed in the material. This material is not and should not be construed as an offer to buy or sell any security. It should not be construed as research or investment advice or a recommendation to buy, sell or hold any security or commodity. This material does not and is not intended to take into account the particular financial conditions, investment objectives or requirements of individual customers. Before acting on this material, you should consider whether it is suitable for your particular circumstances and, as necessary, seek professional advice.
Alternative investments can be highly illiquid, are speculative and may not be suitable for all investors. Investing in Alternative investments is only intended for experienced and sophisticated investors who have a high risk tolerance. Investors should carefully review and consider potential risks before investing. Significant risks may include but are not limited to the loss of all or a portion of an investment due to leverage; lack of liquidity; volatility of returns; restrictions on transferring of interests in a fund; lower diversification; complex tax structures; reduced regulation and higher fees.


Join The Conversation
For specific platform feedback and suggestions, please submit it directly to our team using these instructions.
If you have an account-specific question or concern, please reach out to Client Services.
We encourage you to look through our FAQs before posting. Your question may already be covered!