
- Solve real problems with our hands-on interface
- Progress from basic puts and calls to advanced strategies
Interactive Options Course
Posted June 9, 2025 at 5:34 am
1/ Looking at Bollinger Bands
2/ Circling Back to Yesterday
3/ Don’t Forget Money
4/ Flash Forward to Today
5/ Change in Behavior
Investopedia is partnering with CMT Association on this newsletter. The contents of this newsletter are for informational and educational purposes only, however, and do not constitute investing advice. The guest authors, which may sell research to investors, and may trade or hold positions in securities mentioned herein do not represent the views of CMT Association or Investopedia. Please consult a financial advisor for investment recommendations and services.
Looking at Bollinger Bands
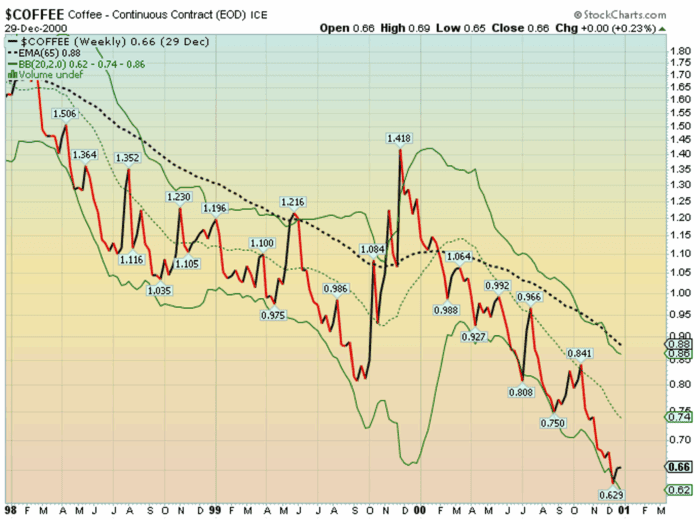
When I first entered the business during the internet trading mania, I didn’t know what a stock was, why it was used on a chart, or even what the Dow was. The markets weren’t a focus of mine during college at Providence College, and my first real exposure to stocks came during my first job as an accountant at Pioneer Funds. In the spring of 2000, I joined “the bear” as a sales assistant, and my education in the markets expanded rapidly. When you work at the center of the universe—on a trading desk—you absorb an incredible amount just from the variety of products being traded around you. But my first real lesson came from something simple: the price of coffee.
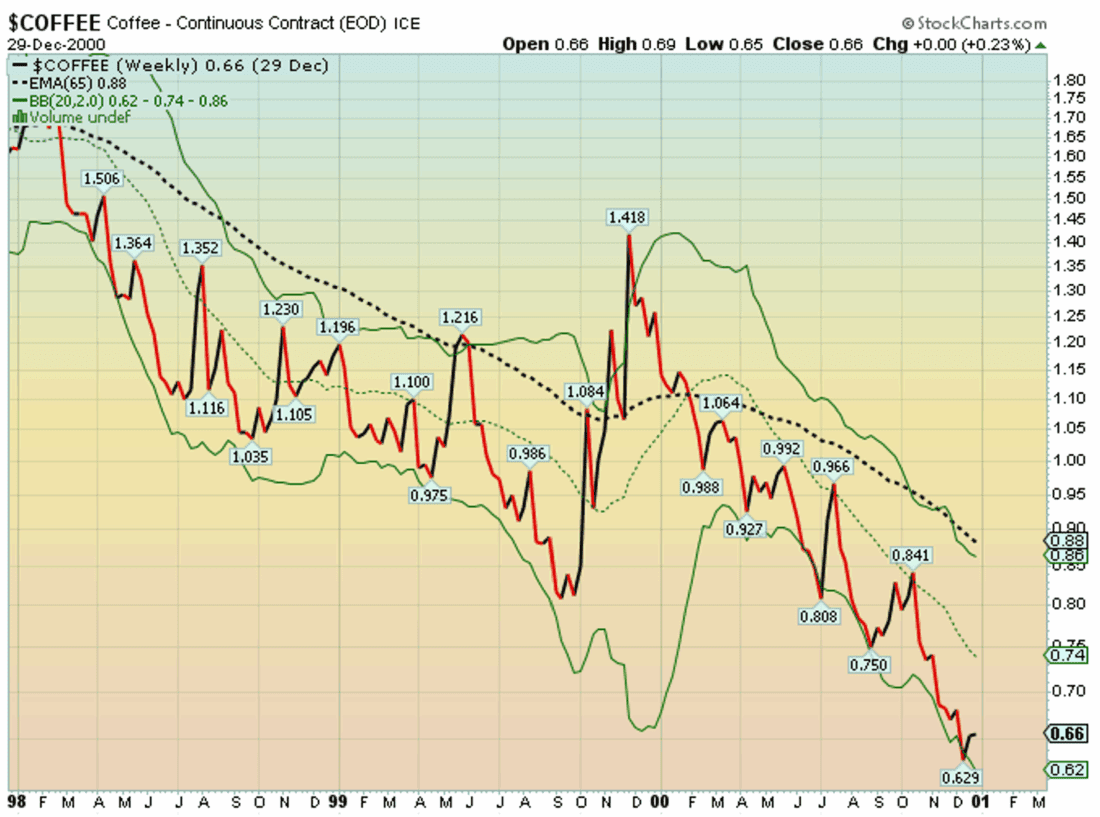
Years ago, we were working on rolling some coffee contracts, and this was the chart of coffee into the end of 2000 (and the start of the Bear market in stocks). The question at the time was: is now the time to buy coffee? Well, based on the chart, it appeared very oversold—so perhaps it was and I was ready to call the floor and buy but I was not sure. If you recall from yesterday’s post, the CRB Index also bottomed out during around this period and began to rally. That aside, my colleague Alan gave me a great piece of advice: if you can’t decide whether to buy a chart, flip it upside down and ask yourself, “Would you sell it?” This is the flipped Coffee Chart

So I flipped the chart and my first thought was, “Well, the momentum looks pretty strong, so perhaps we should wait and see if it turns before selling.” It had broken out past the 1.20 level, and if you extrapolate the move, it pointed toward 1.60 (using one over to invert it). I hadn’t even considered this possibility when looking at the first chart—because, psychologically, as a trader, being a hero is what we all way to be and buy the dip (while selling the rip). My decision though to sell was more thoughtful which in the end, was what I followed.
Circling Back to Yesterday
As I suggested yesterday, the recent move in the greenback somewhat resembled its behavior in 2002—just before several assets, including the CRB and gold, began multiyear rallies. Another asset that joined this trend was coffee, as shown in the chart below. The bounce in coffee, which also coincided with the events of 9/11, year-end government spending, and subsequent Fed actions, helped spark a commodity rally that lasted for years. As you can see on the chart, being thoughtful prevailed being a hero, before it took off at the end of 2002.
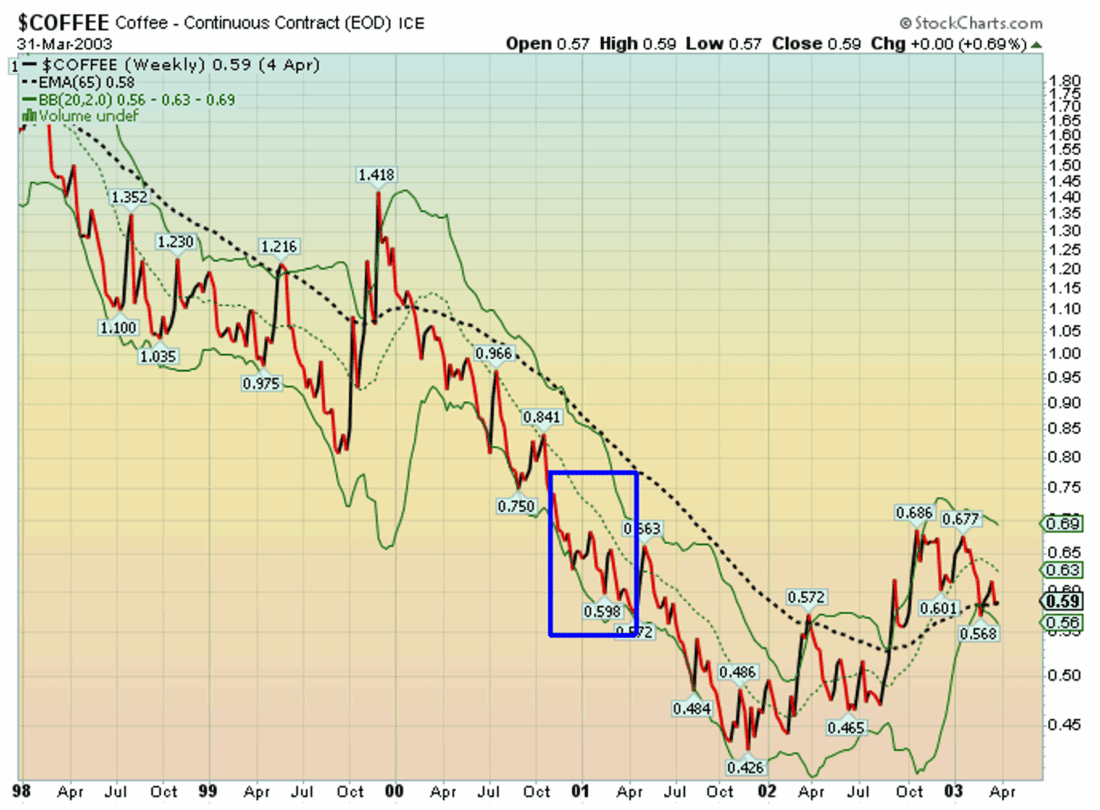
This was my first real technical lesson, which also happened to tie to a tough few years of trading in assets as the bubble burst, 9/11 happened and then the Iraq War began in the spring of 2003 (which was also the launching point for the bull market momentum wise from 2003 to the end of 2007). Be thoughtful and consistent and be less of a cowboy.
Don’t Forget Money
Another early introduction I had to the markets was the use of moving averages. In the coffee charts mentioned earlier, the 65-week moving average helped keep traders out of trouble—though at the time, it wasn’t a metric I used frequently. That changed as I began incorporating moving averages to help clients identify trends across various markets. However, when the moving averages became too close to distinguish visually—and I wasn’t sure if they had actually crossed (charts can only do so much)—I turned to Excel to create a spread. That marked the beginning of my own rudimentary programming, starting in Column E. As any trader knows, though, relying on moving averages as a trading tool can be challenging—the margin for error is high, and over time, they can lead to getting chopped up in the market.
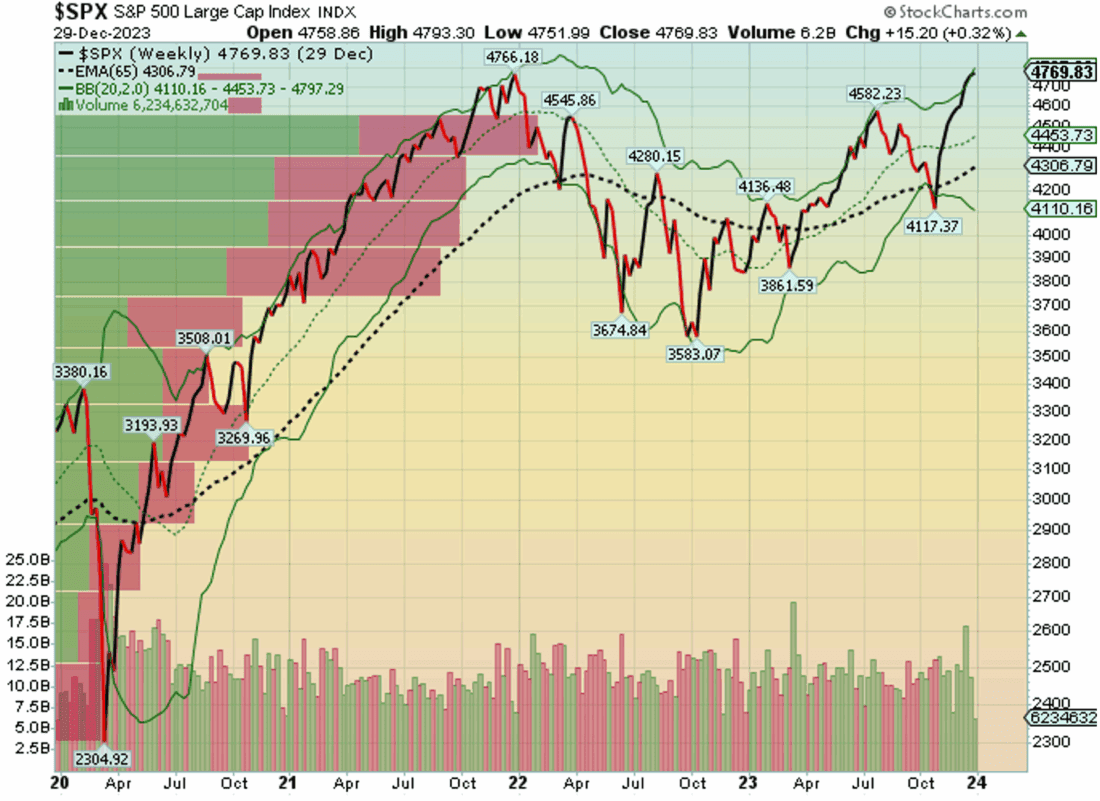
The chart here illustrates what I’m referring to. The dotted line and the bands represent a typical Bollinger Band system (20-week moving average with two standard deviations above and below). Relying on that midline as a buy or sell signal throughout the S&P’s decline would have led to significant whipsaw during the 2000–2002 period, particularly around the 2002/2003 inflection point. While the bands themselves held up reasonably well, using the 20-week moving average in isolation created problems for traders. This was when I first realized that markets often “game” technical analysis—when a moving average comes into play, sometimes the best move is to flip the chart and consider doing the opposite.
Flash Forward to Today
From 2002 to 2007, markets became highly directional at the S&P level, and traders largely shifted away from relying on the 20-week moving average. Instead, they focused on longer-term averages, such as the 65-week, which provided consistent support during pullbacks throughout that period. The 20-week average became more of a turnstile, and the Bollinger Bands served primarily as indicators of increasing momentum rather than useful reversal signals. To be fair, technical analysis was still in its early stages and used primarily on the institutional side and full time traders, vs the main stream, as computers had only recently made it easier to view and analyze charts—replacing the manual charting methods many had relied on. The contrarian approach wasn’t particularly effective in that environment. Buying the dip and selling the rip wasn’t a viable strategy. That trend persisted for several years—until the arrival of the pandemic changed everything.

The chart above shows the S&P 500 from 2020 to 2024. From the 2020 lows, the index followed the 20-week moving average closely all the way to its highs. It held that level almost religiously on shorter timeframes, and countless charts used it as a signal to “buy the dip.” This pattern was supported by the massive influx of liquidity—driven by government stimulus payments and the Fed’s accommodative policies. This behavior continued through the peak in 2025.
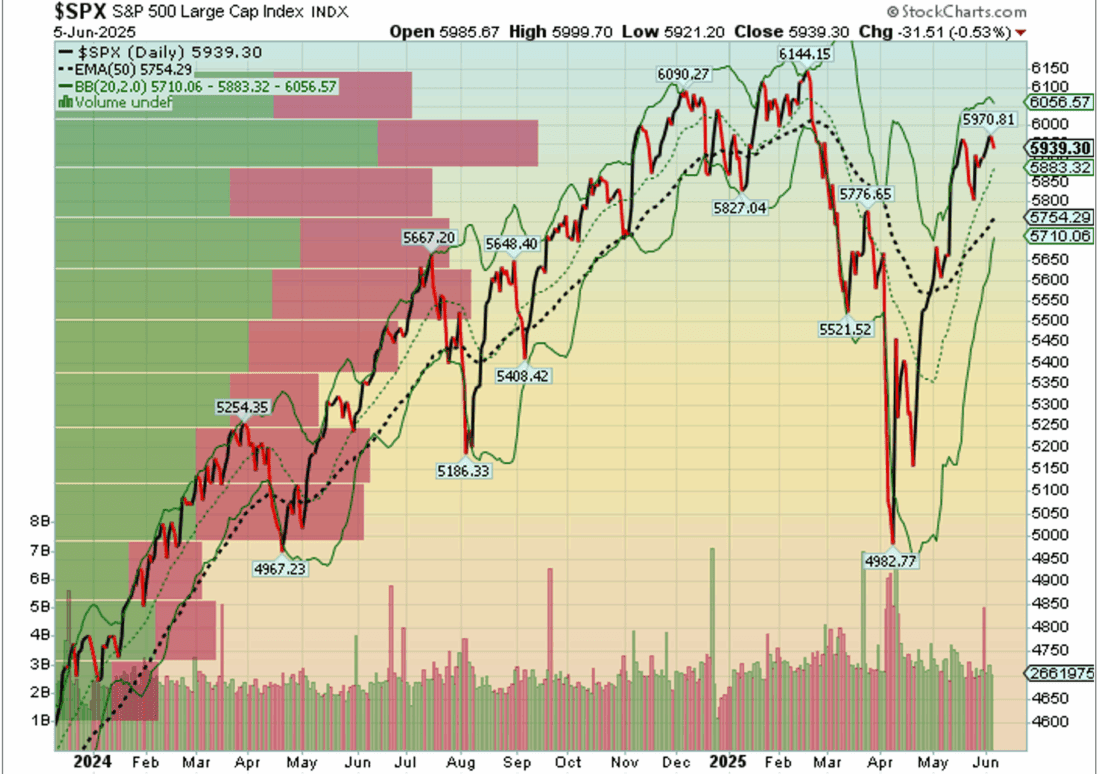
Change in Behavior
A strategy I’ve been monitoring for several years is the 3L, which I built out and is now being advanced by a friend of mine. It relies on momentum to generate gains, but trading in 2025 has been extremely challenging within the system. Fortunately, this has benefited the other side of the trade through options, but it got me thinking: is the market’s behavior starting to change? As the chart here shows, relying on either Bollinger Bands or the 20-day moving average has been a losing proposition. When one works, the other tends to fail. If you speak with any newer trader using technical analysis, they’re likely starting with Bollinger Bands or RSI—both of which are standard features in nearly every basic trading platform and often set as defaults.
Back in 2001, when I first began developing trading methods for what would eventually become a program, I studied the historical performance of two core approaches: mean reversion and trend following. These styles tend to alternate in effectiveness over time, and I found that being a contrarian through 2012 was the most successful strategy. While I haven’t found an updated version of that study, it’s clear that since 2012, money has consistently flowed into equities, and markets have rarely seen prolonged declines. We’ve experienced brief downturns—mini crashes in 2018 and 2020, a longer selloff in 2022, and a five-week drawdown this spring—but nothing sustained, as each dip has been met with aggressive buying, leaving mean reversion trading sitting on the sidelines.
That said, something seems to have shifted beneath the surface. If you scan the markets today, especially among well-known stocks, you’ll find that relying on Bollinger Bands or RSI alone has become a recipe for disaster. My belief is that these tools are being systematically gamed by larger players. This observation is part of a broader study I’m conducting, but here’s one key takeaway for aspiring traders: avoid relying on technical indicators that “everyone” uses. Eventually, they will be exploited by larger trading firms. From 2020 through the 2024 election cycle, momentum chasers dominated the game—but with the arrival of the election, I believe a structural change has occurred. Indicators used in isolation could now lead the average trader astray, especially in a more mean-reverting environment that punishes those blindly chasing momentum.
More on this as I continue to research the evolving dynamics.
—
Originally posted 06th June 2025
Investopedia.com: The comments, opinions and analyses expressed herein are for informational purposes only and should not be considered individual investment advice or recommendations to invest in any security or to adopt any investment strategy. While we believe the information provided herein is reliable, we do not warrant its accuracy or completeness. The views and strategies described on our content may not be suitable for all investors. Because market and economic conditions are subject to rapid change, all comments, opinions and analyses contained within our content are rendered as of the date of the posting and may change without notice. The material is not intended as a complete analysis of every material fact regarding any country, region, market, industry, investment or strategy. This information is intended for US residents only.
Information posted on IBKR Campus that is provided by third-parties does NOT constitute a recommendation that you should contract for the services of that third party. Third-party participants who contribute to IBKR Campus are independent of Interactive Brokers and Interactive Brokers does not make any representations or warranties concerning the services offered, their past or future performance, or the accuracy of the information provided by the third party. Past performance is no guarantee of future results.
This material is from Investopedia and is being posted with its permission. The views expressed in this material are solely those of the author and/or Investopedia and Interactive Brokers is not endorsing or recommending any investment or trading discussed in the material. This material is not and should not be construed as an offer to buy or sell any security. It should not be construed as research or investment advice or a recommendation to buy, sell or hold any security or commodity. This material does not and is not intended to take into account the particular financial conditions, investment objectives or requirements of individual customers. Before acting on this material, you should consider whether it is suitable for your particular circumstances and, as necessary, seek professional advice.
Any discussion or mention of an ETF is not to be construed as recommendation, promotion or solicitation. All investors should review and consider associated investment risks, charges and expenses of the investment company or fund prior to investing. Before acting on this material, you should consider whether it is suitable for your particular circumstances and, as necessary, seek professional advice.
Related Articles


Join The Conversation
For specific platform feedback and suggestions, please submit it directly to our team using these instructions.
If you have an account-specific question or concern, please reach out to Client Services.
We encourage you to look through our FAQs before posting. Your question may already be covered!