
- Solve real problems with our hands-on interface
- Progress from basic puts and calls to advanced strategies
Interactive Options Course
Posted May 1, 2025 at 8:52 am
From SIA Charts
1/ Servicenow Inc. (NOW)
2/ Point and Figure Chart
3/ Candlestick Chart
Investopedia is partnering with CMT Association on this newsletter. The contents of this newsletter are for informational and educational purposes only, however, and do not constitute investing advice. The guest authors, which may sell research to investors, and may trade or hold positions in securities mentioned herein do not represent the views of CMT Association or Investopedia. Please consult a financial advisor for investment recommendations and services.
Servicenow Inc. (NOW)
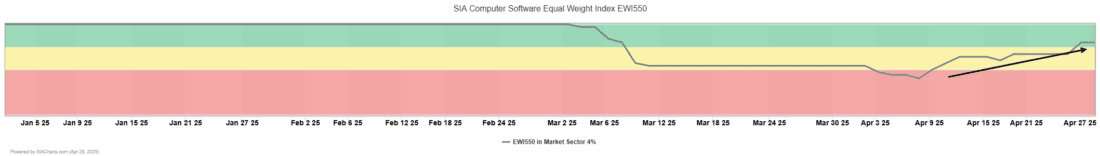
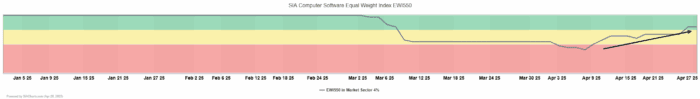
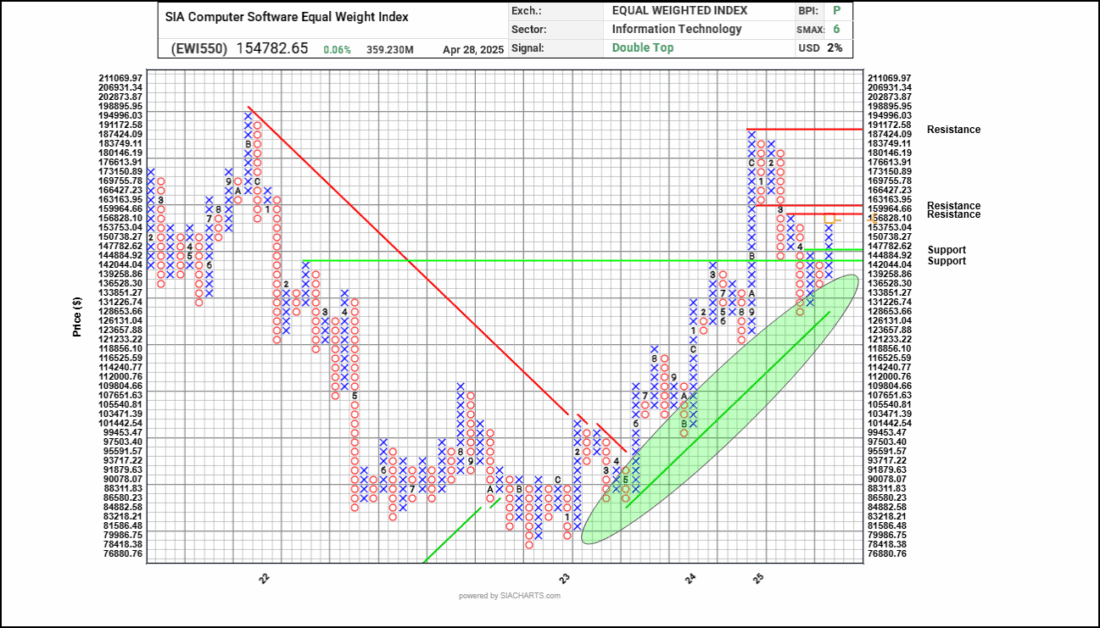
In today’s analysis, we take a look at the SIA Computer Software sector, which has re-entered the favored zone of the SIA Sector Report, as highlighted in the attached SIA matrix position chart. Initially favored at the start of 2025, the sector briefly declined into the yellow and then the unfavored red zone before recovering back into favor, where it currently holds position #7. Also attached is the point and figure chart of the SIA Computer Software Equal Weight Index, which shows a correction from 191,000 to as low as 130,000 during the market selloff in March and April. However, the index found support along the trend line (highlighted with a green oval) and has recently completed a double top point and figure buy signal as it re-entered the favored zone. Key support levels are now at 144,884 and along trend at 128,000, while resistance may begin at 159,964, with upper resistance at 191,172.
Point and Figure Chart
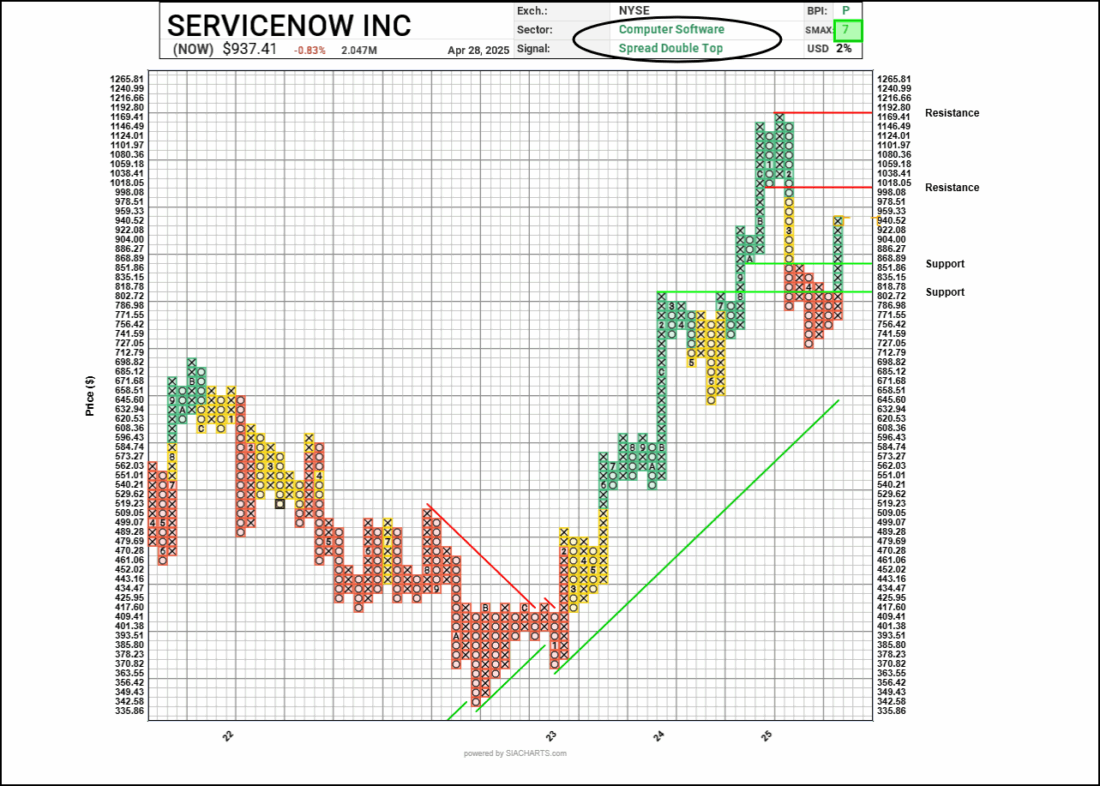
Against this sector backdrop, we now turn to the point and figure chart of ServiceNow Inc. (NOW), which closely tracked the sector’s movement with a pullback in March and April before finding support along trend. Shares of NOW fell from $1,169 down to $727, a level that attracted buyer interest. After forming a price discovery triangle, shares broke out to the upside, completing two point and figure double tops at $818 and $868. Shares may face new resistance at $1,018—closely aligned with the psychological $1,000 level—and at the previous high of $1,192, assuming buyer demand remains strong. This technical setup is supported by a SIA SMAX score of 7 out of 10, indicating positive near-term relative strength against other asset classes, in addition to the favorable positioning of the broader sector discussed above.
Candlestick Chart
ServiceNow Inc. (NYSE: NOW) is a leading provider of cloud-based digital workflow solutions that help automate enterprise operations across IT, HR, customer service, and other functions. Central to its strategy is the AI-powered Now Platform, which enables organizations to streamline operations and reduce costs. By offering tools that enhance efficiency and modernization, ServiceNow has positioned itself as a critical partner in digital transformation efforts across both private and public sectors. Its strong performance in government contracts—despite budget constraints—underscores the growing demand for its solutions and the strategic value it delivers.
—
Originally posted 30th April 2025
Investopedia.com: The comments, opinions and analyses expressed herein are for informational purposes only and should not be considered individual investment advice or recommendations to invest in any security or to adopt any investment strategy. While we believe the information provided herein is reliable, we do not warrant its accuracy or completeness. The views and strategies described on our content may not be suitable for all investors. Because market and economic conditions are subject to rapid change, all comments, opinions and analyses contained within our content are rendered as of the date of the posting and may change without notice. The material is not intended as a complete analysis of every material fact regarding any country, region, market, industry, investment or strategy. This information is intended for US residents only.
Information posted on IBKR Campus that is provided by third-parties does NOT constitute a recommendation that you should contract for the services of that third party. Third-party participants who contribute to IBKR Campus are independent of Interactive Brokers and Interactive Brokers does not make any representations or warranties concerning the services offered, their past or future performance, or the accuracy of the information provided by the third party. Past performance is no guarantee of future results.
This material is from Investopedia and is being posted with its permission. The views expressed in this material are solely those of the author and/or Investopedia and Interactive Brokers is not endorsing or recommending any investment or trading discussed in the material. This material is not and should not be construed as an offer to buy or sell any security. It should not be construed as research or investment advice or a recommendation to buy, sell or hold any security or commodity. This material does not and is not intended to take into account the particular financial conditions, investment objectives or requirements of individual customers. Before acting on this material, you should consider whether it is suitable for your particular circumstances and, as necessary, seek professional advice.
Related Articles


Join The Conversation
For specific platform feedback and suggestions, please submit it directly to our team using these instructions.
If you have an account-specific question or concern, please reach out to Client Services.
We encourage you to look through our FAQs before posting. Your question may already be covered!