
- Solve real problems with our hands-on interface
- Progress from basic puts and calls to advanced strategies
Interactive Options Course
Posted February 13, 2025 at 5:26 am
From SIA Charts
1/ Paypal Holdings Inc. (PYPL)
2/ Point and Figure Chart
3/ Candlestick Chart
Investopedia is partnering with CMT Association on this newsletter. The contents of this newsletter are for informational and educational purposes only, however, and do not constitute investing advice. The guest authors, which may sell research to investors, and may trade or hold positions in securities mentioned herein do not represent the views of CMT Association or Investopedia. Please consult a financial advisor for investment recommendations and services.
Paypal Holdings Inc. (PYPL)
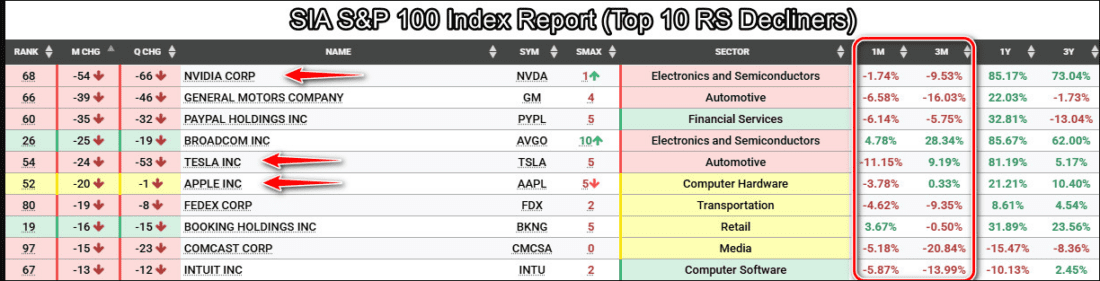
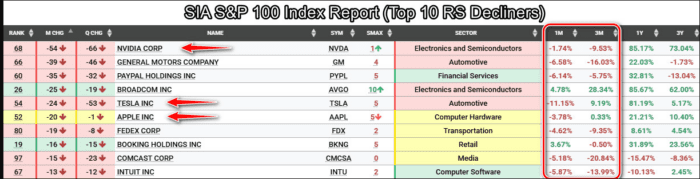
In today’s report, we analyzed the SIA S&P 100 Index Report and sorted the data by monthly and quarterly relative strength decliners to identify areas that are losing momentum or becoming a potential drag on the overall markets. The results were surprising. The table above illustrates the 10 biggest relative strength decliners, with three of these names being part of the Magnificent 7, which were the stars of the 2024 market rally. As we move into the middle of Q1 2025, several of these names may be signaling an early warning, as money flows appear to be shifting elsewhere. Nvidia Corp (NVDA) tops the list of relative strength decliners, followed closely by General Motors (GM). Despite posting a 32.81% gain over the past year, PayPal Holdings Inc (PYPL) has suffered a decline of -6.14% in the first month of 2025. Notably, Tesla Inc. (TSLA) and Apple Inc. (AAPL), both part of the Magnificent 7, also appear on the list of top decliners. An unexpected inclusion is Booking Holdings Inc. (BKNG), which ranks 8th on the list. Although its return over the past month is positive, it may be in transition, especially given its now negative SIA SMAX score of 5.
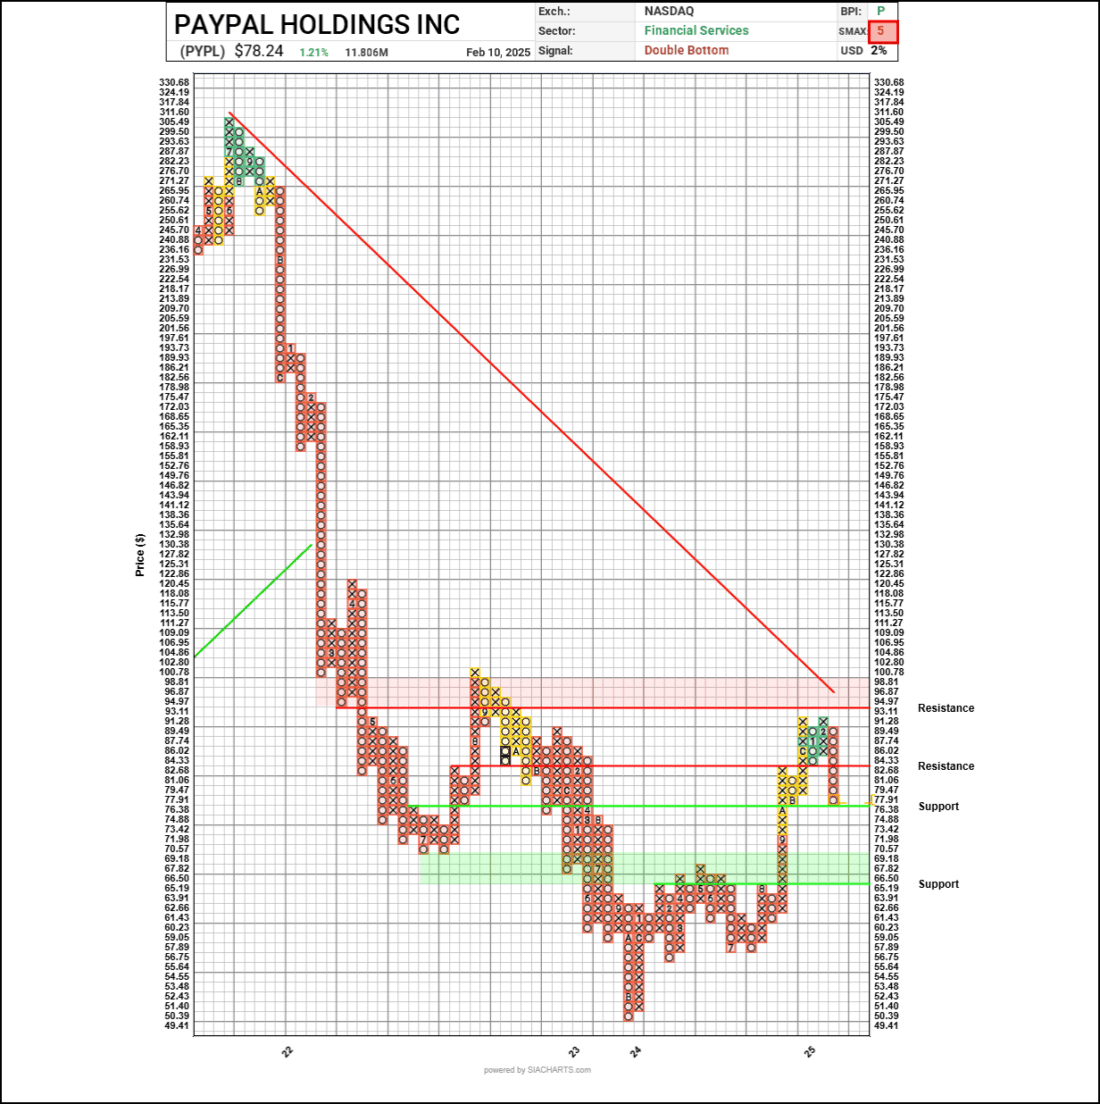
Point and Figure Chart
The Point and Figure (PNF) chart presented is a textbook example of how PNF charts allow advisors to monitor long-term trend lines. For seasoned technical analysts, it is striking how stocks tend to revert to the mean, either bouncing off a down-sloping trend line or correcting back to a positive trend line—an occurrence that might be seen with Tesla (see daily stock report from November 14, 2024). In the case of PayPal, the stock broke past resistance at $69 in 2024 and moved up toward the trend line, but it now appears to be finding new resistance along a negative trend at $93.11, just short of the resistance that whole numbers like $100 may have on investor psychology. More importantly, any relative strength PayPal exhibited late last year was short-lived, and the shares have now sunk to the bottom of the SIA S&P 100 Index Report. PayPal is currently at support around $76.38, with additional support levels at $69.18-$65.19.
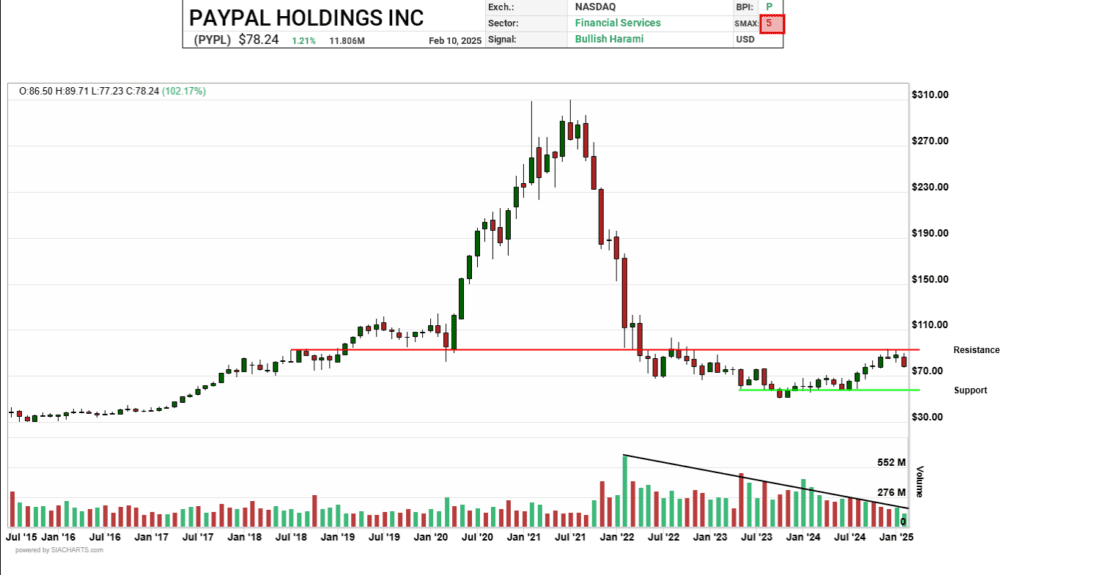
Candlestick Chart
To provide a broader view of PayPal’s trading history, we’ve included a monthly candlestick chart. This chart clearly shows the massive share price run-up in 2021, when shares reached $300, but this rally has since dissipated. The share price is now stuck below long-term resistance at approximately $75, with shorter-term support at the $60-$65 range. The rally that began late last year is losing steam, as reflected in the diminishing volume, highlighted by a thin black line. Currently, PayPal carries a negative SIA SMAX score of 5 out of 10, reflecting weak relative strength against other asset classes, in addition to the analysis captured in the SIA S&P 100 Index Report.
—
Originally posted 12th February 2025
Investopedia.com: The comments, opinions and analyses expressed herein are for informational purposes only and should not be considered individual investment advice or recommendations to invest in any security or to adopt any investment strategy. While we believe the information provided herein is reliable, we do not warrant its accuracy or completeness. The views and strategies described on our content may not be suitable for all investors. Because market and economic conditions are subject to rapid change, all comments, opinions and analyses contained within our content are rendered as of the date of the posting and may change without notice. The material is not intended as a complete analysis of every material fact regarding any country, region, market, industry, investment or strategy. This information is intended for US residents only.
Information posted on IBKR Campus that is provided by third-parties does NOT constitute a recommendation that you should contract for the services of that third party. Third-party participants who contribute to IBKR Campus are independent of Interactive Brokers and Interactive Brokers does not make any representations or warranties concerning the services offered, their past or future performance, or the accuracy of the information provided by the third party. Past performance is no guarantee of future results.
This material is from Investopedia and is being posted with its permission. The views expressed in this material are solely those of the author and/or Investopedia and Interactive Brokers is not endorsing or recommending any investment or trading discussed in the material. This material is not and should not be construed as an offer to buy or sell any security. It should not be construed as research or investment advice or a recommendation to buy, sell or hold any security or commodity. This material does not and is not intended to take into account the particular financial conditions, investment objectives or requirements of individual customers. Before acting on this material, you should consider whether it is suitable for your particular circumstances and, as necessary, seek professional advice.
Related Articles


Join The Conversation
For specific platform feedback and suggestions, please submit it directly to our team using these instructions.
If you have an account-specific question or concern, please reach out to Client Services.
We encourage you to look through our FAQs before posting. Your question may already be covered!