
- Solve real problems with our hands-on interface
- Progress from basic puts and calls to advanced strategies
Interactive Options Course
Posted February 19, 2026 at 3:26 am
By Alex Cole
1/ Momentum Indicators and their Value
2/ Powerful Concepts
3/ “Go” Trend Appears
Investopedia is partnering with CMT Association on this newsletter. The contents of this newsletter are for informational and educational purposes only, however, and do not constitute investing advice. The guest authors, which may sell research to investors, and may trade or hold positions in securities mentioned herein do not represent the views of CMT Association or Investopedia. Please consult a financial advisor for investment recommendations and services.
Momentum Indicators and their Value
Momentum represents the acceleration of price movement. The trader can use it to understand the velocity of price change and whether a trend is strong or nearing exhaustion. As a race car fan, and with the Formula one season about to start, we can use a car’s acceleration as a proxy for momentum.
Imagine a car accelerating onto a highway. It will get faster quickly at first, from 10-20, 20-30, 30-40mph. The rate of change is the same. But as you approach the highway speed limit the car will continue to get faster but at a slower rate. The car will get faster more slowly! From 40-45, 45-48, 48-50. At the speed limit (50mph in New Jersey) you are likely to stop accelerating or risk the long arm of the law! Decreasing acceleration therefore precedes top speed. Most likely, we will then eventually slow down to exit.
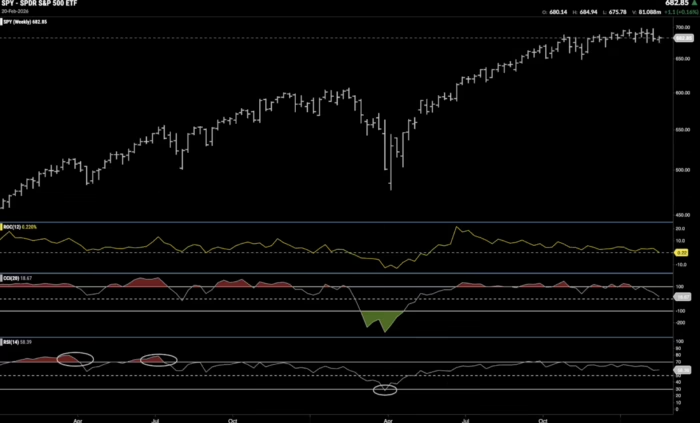
So it is with price momentum. If price makes a higher high, we would like to see it maintain momentum. If price climbs but momentum wanes, it is like the car accelerating more slowly! We may be reaching top speed and further price gains may be difficult to achieve and we may even see a pull back. The first chart is a chart displaying weekly SPY prices with some popular momentum indicators applied. ROC, CCI, and RSI.
Powerful Concepts
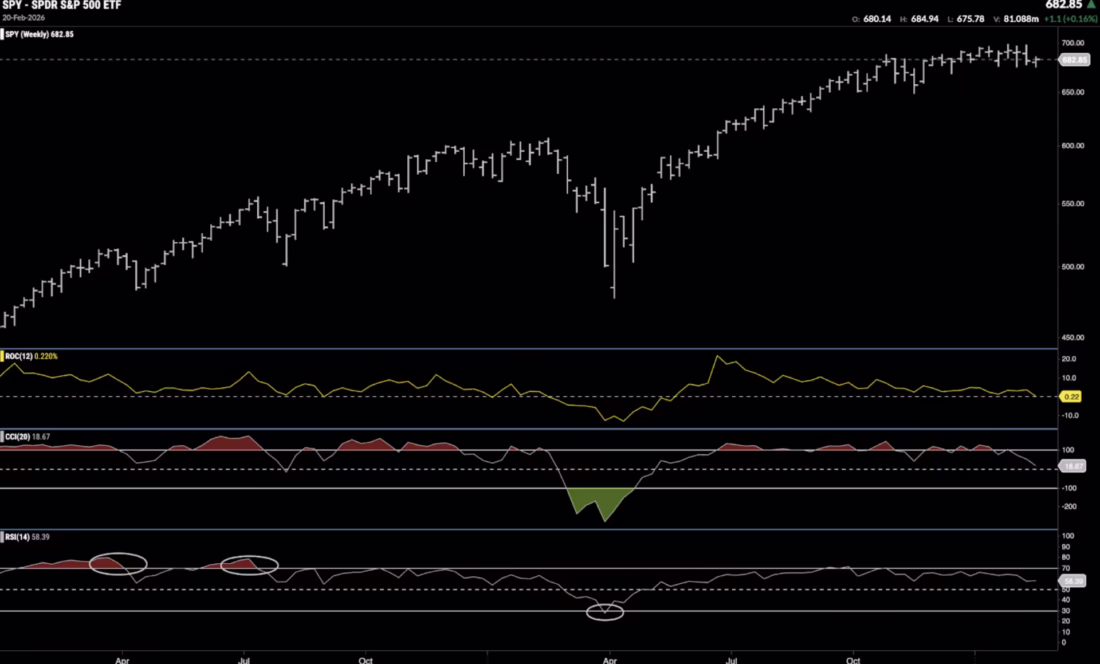
Remember, momentum indicators measure the velocity of price movement. If market enthusiasm drives price quickly in one direction it can become overbought, or oversold. At these extremes, a technician may expect price to revert to its mean in the short term. Using RSI as an example with SPY prices, we note that when the oscillator moves above 70, it is overbought. When it moves below 30 it is oversold. We have used ellipse annotations to highlight on the chart. Often, following these, price reverts to the trend (red and green arrows).
Oscillator divergence is another important momentum concept. If we think back to our accelerating car, when it is getting faster but at a slower rate, that is divergence. When price makes a higher high but momentum makes a lower high we know that price is climbing but with less enthusiasm. Perhaps price has hit its “top speed”. Again, using the chart above, we can see divergence highlighted with blue arrows. Currently, price is making slightly higher highs while RSI is making lower highs. Is price about to struggle in the near future?
“Go” Trend Appears
Yesterday, we saw that when we added trend identification concepts to our chart we risked missing the bigger picture due to analysis paralysis. Imagine adding 3 or 4 momentum indicators to that same chart! Our chart would be hard to read and our judgement clouded. We know there is value in this analysis but we risk redundancy and even contradiction as we add more.

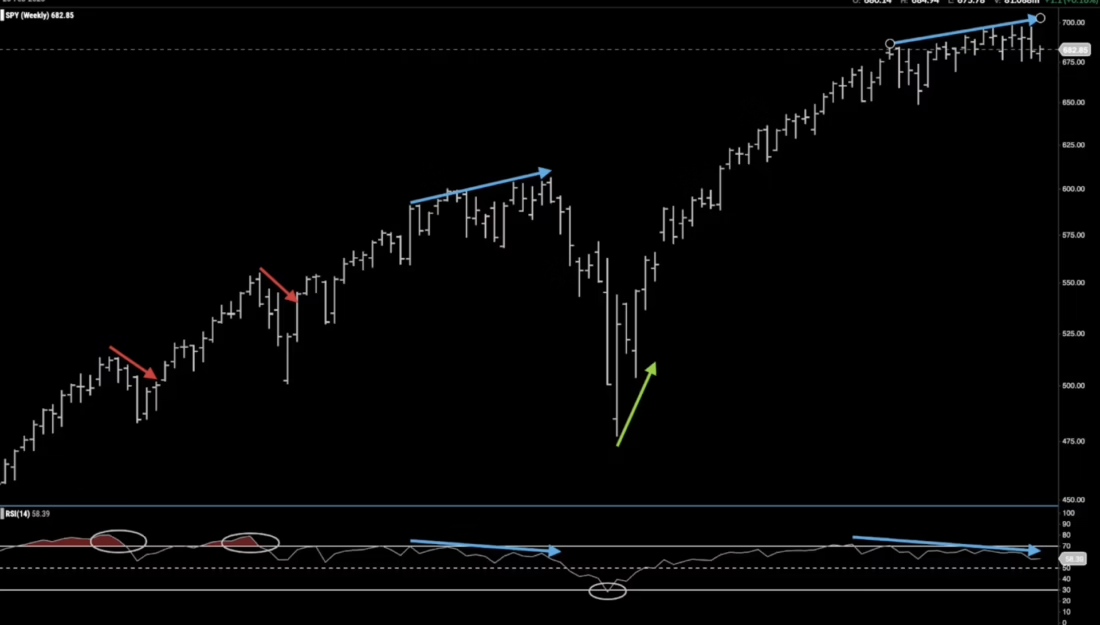
In this last chart, we have weekly SPY prices with the GoNoGo Oscillator applied. From working for decades with professional technicians we know that we need insight without indecision! GoNoGo Oscillator takes the same approach as GoNoGo Trend. In the background, the oscillator calculates several of the most robust momentum tools and blends them into one oscillator that can be added to our chart. We can identify areas of overbought and oversold extremes (ellipses), and easily pick out divergence from price (grey arrows). Adding the GoNoGo Oscillator we have a sound understanding of momentum analysis, and keeping it all in only one panel makes sure we focus on simplicity and remove complication.
—
Originally posted 18th February 2026
Investopedia.com: The comments, opinions and analyses expressed herein are for informational purposes only and should not be considered individual investment advice or recommendations to invest in any security or to adopt any investment strategy. While we believe the information provided herein is reliable, we do not warrant its accuracy or completeness. The views and strategies described on our content may not be suitable for all investors. Because market and economic conditions are subject to rapid change, all comments, opinions and analyses contained within our content are rendered as of the date of the posting and may change without notice. The material is not intended as a complete analysis of every material fact regarding any country, region, market, industry, investment or strategy. This information is intended for US residents only.
Information posted on IBKR Campus that is provided by third-parties does NOT constitute a recommendation that you should contract for the services of that third party. Third-party participants who contribute to IBKR Campus are independent of Interactive Brokers and Interactive Brokers does not make any representations or warranties concerning the services offered, their past or future performance, or the accuracy of the information provided by the third party. Past performance is no guarantee of future results.
This material is from Investopedia and is being posted with its permission. The views expressed in this material are solely those of the author and/or Investopedia and Interactive Brokers is not endorsing or recommending any investment or trading discussed in the material. This material is not and should not be construed as an offer to buy or sell any security. It should not be construed as research or investment advice or a recommendation to buy, sell or hold any security or commodity. This material does not and is not intended to take into account the particular financial conditions, investment objectives or requirements of individual customers. Before acting on this material, you should consider whether it is suitable for your particular circumstances and, as necessary, seek professional advice.
Any discussion or mention of an ETF is not to be construed as recommendation, promotion or solicitation. All investors should review and consider associated investment risks, charges and expenses of the investment company or fund prior to investing. Before acting on this material, you should consider whether it is suitable for your particular circumstances and, as necessary, seek professional advice.
Related Articles


Join The Conversation
For specific platform feedback and suggestions, please submit it directly to our team using these instructions.
If you have an account-specific question or concern, please reach out to Client Services.
We encourage you to look through our FAQs before posting. Your question may already be covered!