
- Solve real problems with our hands-on interface
- Progress from basic puts and calls to advanced strategies
Interactive Options Course
Latest Webinars

Posted July 21, 2025 at 9:19 am
By C. Theodore Hicks II, CMT, CFP, CKA
1/ Measure Risk First
2/ Contrarian Trade, Logic and Trends
3/ What We Want – ITA
4/ What’s Strongest – Crypto
Investopedia is partnering with CMT Association on this newsletter. The contents of this newsletter are for informational and educational purposes only, however, and do not constitute investing advice. The guest authors, which may sell research to investors, and may trade or hold positions in securities mentioned herein do not represent the views of CMT Association or Investopedia. Please consult a financial advisor for investment recommendations and services.
Measure Risk First
After working in the retail money management industry for close to 30 years, I have absolutely developed a few strong convictions along the way. One of my convictions is that before we invest in a stock, ETF or any other vehicle, we should first assess the overall environment. If the overall environment is not rewarding risk-taking, why take the risk?
After shepherding clients through both the dot com crisis and the Global Financial Crisis (and getting crushed along the way), I realized that what I had been taught in college was not working. Unfortunately, those same failed concepts that I was taught in college were widely preached throughout the industry. For the sake of brevity, just know that I was doing everything that academia and the industry preached. My clients were diversified. We were patient. But we still got crushed.
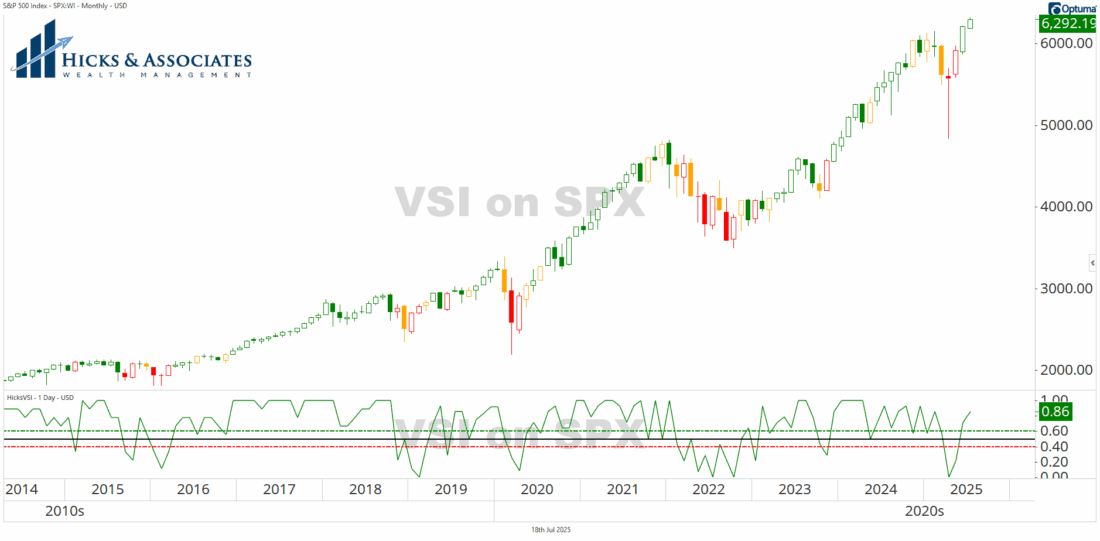
Ultimately, this led me to the CMT Association and my CMT Charter. Through that work, I eventually developed a composite risk gauge which is shown in Chart #1. In short, this is one way my team and I measure the risk of the environment. It is also color coded. Here we can see that as of Friday, we are on a green candle.
Contrarian Trade, Logic and Trends
Late last week, I had a brief exchange with someone on LinkedIn about TLT, the iShares 20-Year Bond ETF. Chart #2 is showing the weekly chart for TLT. While I do not recall how the conversation started, this individual stated that he liked TLT as a “contrarian trade”. While he supported his idea with some logic, I simply looked at the chart. There’s absolutely nothing on this chart that compels me to think we should be holding TLT. It has been in a clear downtrend since 2020. One could argue that it has found support and should move higher off the support. Fine. Go right ahead.
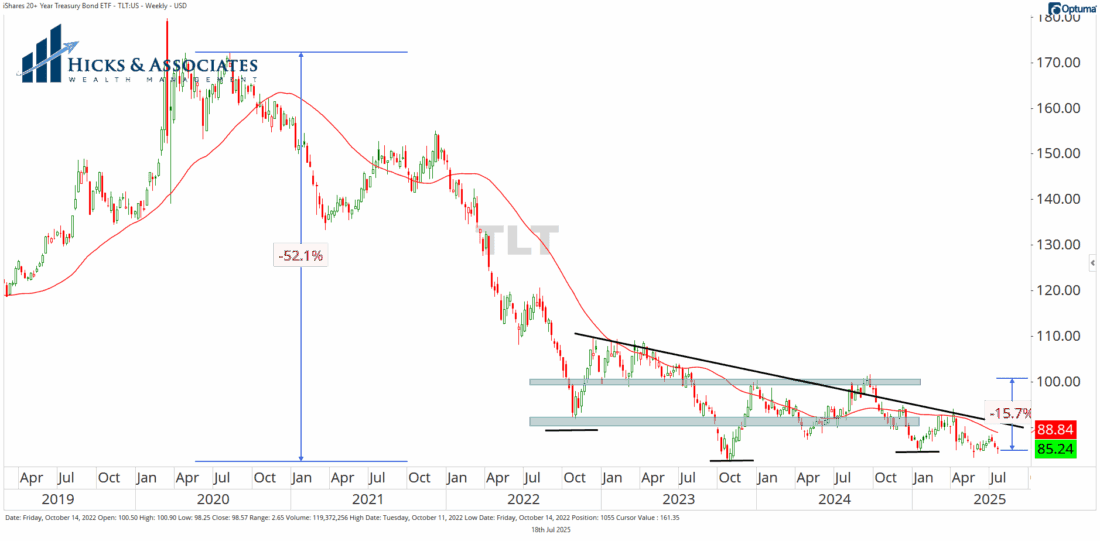
If you consider yourself to be a Long-Term Investor, go ahead and buy TLT. As for me, I’ll wait until we can see evidence that the trend has indeed changed. I’m not investing client capital in TLT ‘til we see the trend is positive.
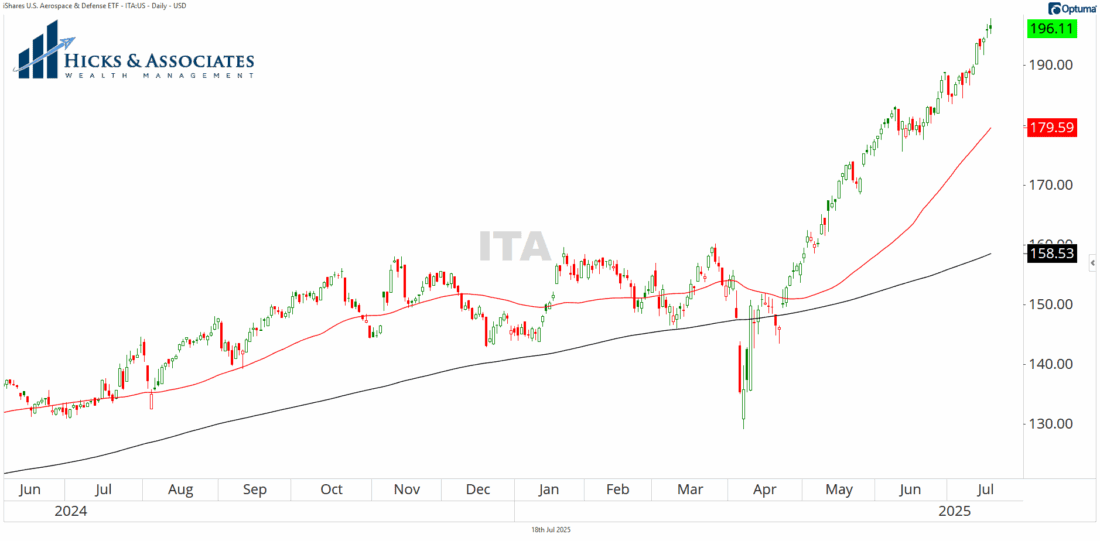
What We Want – ITA
Chart #3 is an example of what we want to be holding. Unfortunately, we missed this trade, so we are not holding this right now. (Nor am I recommending that you buy this right now.) But this is a clear example of what we want to be holding. ITA clearly has some relative strength over the rest of the market.
What’s Strongest – Crypto
Chart #4 is an example of how we enter a position in our Sector Rotation model. To be clear, we are not currently holding IBIT. We are, however, holding a couple of other crypto related ETFs. But, again, I am not recommending that you buy this or any other position.
In this chart, I’ve added a blue-gray rectangle to illustrate what we viewed as classic resistance. In our studies of the stock market, when a stock or ETF breaks through an area of resistance, it can really start to move. Furthermore, if that resistance has been in place for some time, that move higher can be explosive. Nothing is guaranteed of course. But that’s the theory.
You will also see two dates marked on this chart along with a down-trendline.
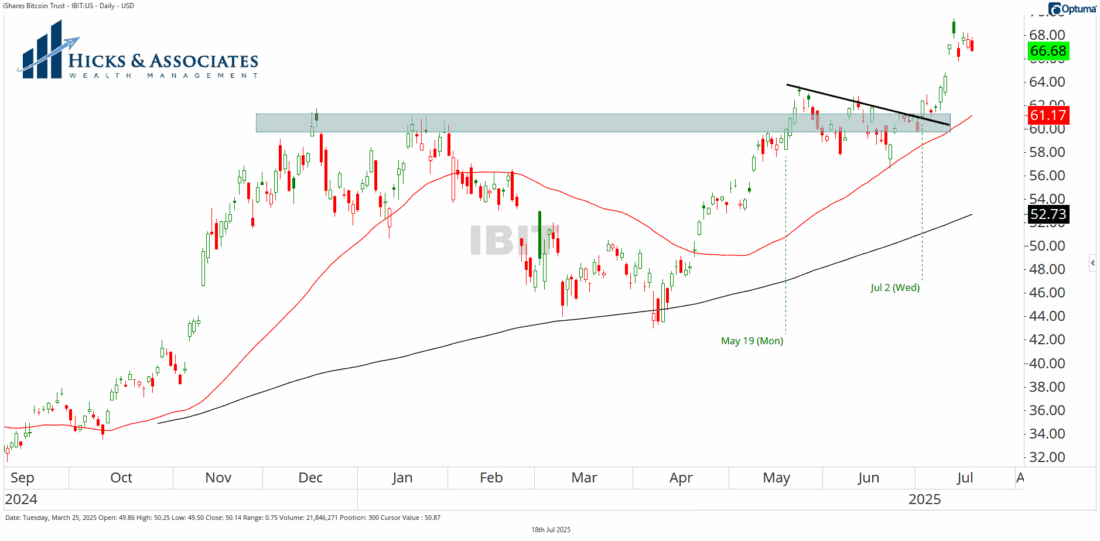
The first date represents, in our view, the first place we would enter this trade. Technically, the position is moving into that area of resistance. However, it is breaking above the highs from the last couple of days. That is the first area where we would consider buying this position.
As the ETF broke through the resistance, it then consolidated sideways with a downward slant – hence the black down-trendline. That second date marked is the second spot where we would typically initiate a position.
While it is still early in this trade, this is how we want to enter a trade. Hopefully, the trend will end up looking like ITA in Chart #3. But we cannot know that in advance. What we can know is that:
P.S. If I could, I would trade Pokemon cards for clients. I posted this on LinkedIn here. You are welcome to connect with me there.
—
Originally posted 21st July 2025
Investopedia.com: The comments, opinions and analyses expressed herein are for informational purposes only and should not be considered individual investment advice or recommendations to invest in any security or to adopt any investment strategy. While we believe the information provided herein is reliable, we do not warrant its accuracy or completeness. The views and strategies described on our content may not be suitable for all investors. Because market and economic conditions are subject to rapid change, all comments, opinions and analyses contained within our content are rendered as of the date of the posting and may change without notice. The material is not intended as a complete analysis of every material fact regarding any country, region, market, industry, investment or strategy. This information is intended for US residents only.
Information posted on IBKR Campus that is provided by third-parties does NOT constitute a recommendation that you should contract for the services of that third party. Third-party participants who contribute to IBKR Campus are independent of Interactive Brokers and Interactive Brokers does not make any representations or warranties concerning the services offered, their past or future performance, or the accuracy of the information provided by the third party. Past performance is no guarantee of future results.
This material is from Investopedia and is being posted with its permission. The views expressed in this material are solely those of the author and/or Investopedia and Interactive Brokers is not endorsing or recommending any investment or trading discussed in the material. This material is not and should not be construed as an offer to buy or sell any security. It should not be construed as research or investment advice or a recommendation to buy, sell or hold any security or commodity. This material does not and is not intended to take into account the particular financial conditions, investment objectives or requirements of individual customers. Before acting on this material, you should consider whether it is suitable for your particular circumstances and, as necessary, seek professional advice.
Any discussion or mention of an ETF is not to be construed as recommendation, promotion or solicitation. All investors should review and consider associated investment risks, charges and expenses of the investment company or fund prior to investing. Before acting on this material, you should consider whether it is suitable for your particular circumstances and, as necessary, seek professional advice.
Cryptocurrency based Exchange Traded Products (ETPs) are high risk and speculative. Cryptocurrency ETPs are not suitable for all investors. You may lose your entire investment. For more information please view the RISK DISCLOSURE REGARDING COMPLEX OR LEVERAGED EXCHANGE TRADED PRODUCTS.
Municipal Bonds are only available from Interactive Brokers for IBKR LLC, IBKR Canada, IBKR Hong Kong, IBKR Australia and IBKR Singapore entities.
Related Articles


")

Join The Conversation
For specific platform feedback and suggestions, please submit it directly to our team using these instructions.
If you have an account-specific question or concern, please reach out to Client Services.
We encourage you to look through our FAQs before posting. Your question may already be covered!