
- Solve real problems with our hands-on interface
- Progress from basic puts and calls to advanced strategies
Interactive Options Course
Posted May 9, 2025 at 10:26 am
Mastering the Relative Strength Index (RSI): How to Read it Correctly
Investopedia is partnering with CMT Association on this newsletter. The contents of this newsletter are for informational and educational purposes only, however, and do not constitute investing advice. The guest authors, which may sell research to investors, and may trade or hold positions in securities mentioned herein do not represent the views of CMT Association or Investopedia. Please consult a financial advisor for investment recommendations and services.
Mastering the Relative Strength Index (RSI): How to Read it Correctly
Author’s Note: Over two decades of watching charts on a daily basis, I’ve misused the RSI early on and missed its deeper signals. This article shares the lessons I wish I had fully grasped sooner — insights that have proven to be reliable across markets, trends, and time.
The Relative Strength Index (RSI) is one of the most popular momentum oscillators in technical analysis. While many traders treat it as a simple overbought/oversold signal, deeper research and long-term observation show that RSI’s behavior shifts depending on the underlying market trend.
This article explains how RSI “range rules” work, why overbought readings can actually signal strength, and how traders and investors can apply these insights effectively across asset classes.
Understanding RSI: Beyond the 0 to 100 Scale
The RSI is typically plotted on a scale from 0 to 100, with overbought levels defined above 70 and oversold levels below 30. Many beginners — myself included in the early years of my career — interpret these thresholds as automatic trade signals: buy when oversold, sell when overbought.
However, this approach often fails in trending markets. With time and experience, I realized that simply reacting to these levels leads to false signals and premature exits from strong trends.
RSI Range Rules: A More Nuanced Approach
Constance Brown, in her influential book Technical Analysis for the Trading Professional, introduced the concept of RSI range rules, which state:
In an uptrend, RSI operates in a bullish range with lows near 40–50 and highs between 80–90.
In a downtrend, RSI stays in a bearish range with lows around 20–30 and highs limited to 55–65.
Rather than focusing solely on extreme levels, traders should observe how high or how low the RSI goes relative to these trend-defined ranges. In my own experience, recognizing these ranges was a breakthrough that helped me shift from chasing reversals to riding trends more confidently.
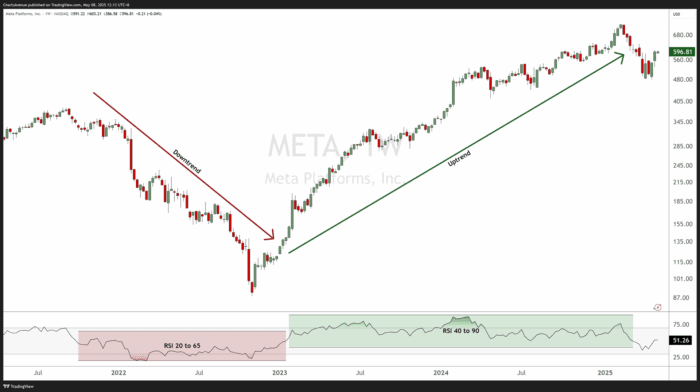
Example 1: Meta Platforms (META)
On the weekly chart of Meta Platforms (META), the RSI behavior shifted depending on the trend:
Downtrend phase: RSI fluctuated between ~20–30 on pullbacks and ~55–65 on rallies.
Uptrend phase: RSI lows stabilized above ~40–50, while highs extended into the 80–90 zone.
A key insight is that trend reversals often begin when the RSI no longer reaches prior extremes — a subtle but powerful signal of changing market dynamics. I’ve come to rely on this as one of my earliest clues that a market phase may be transitioning.
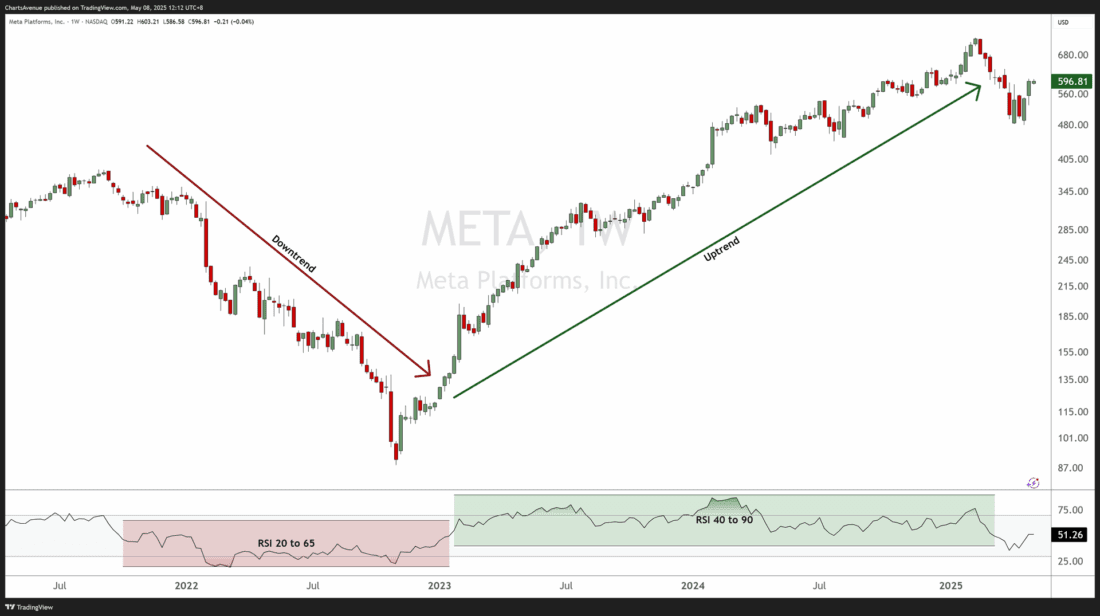
Meta weekly chart: Typical RSI ranges in downtrends (20–65) vs. uptrends (40–90).
Example 2: Tencent Holdings (700 HK)
Tencent’s monthly chart highlights RSI’s long-term value. While a traditional moving average crossover system would have triggered multiple whipsaws, RSI stayed in a bullish range for nearly 18 years, keeping traders and investors aligned with the prevailing uptrend.
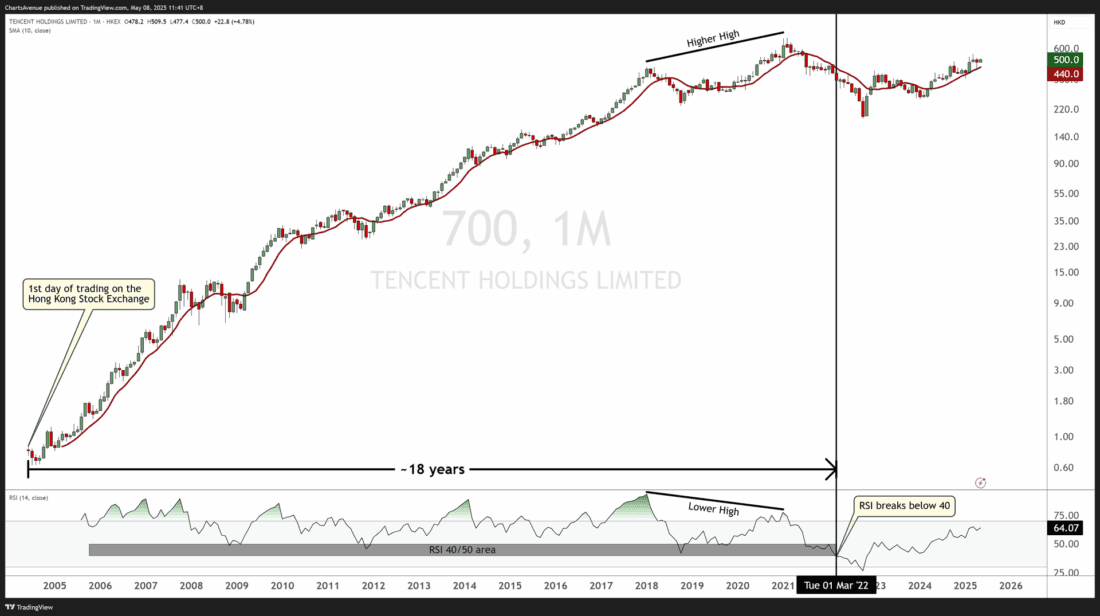
Tencent (700 HK) monthly chart: showing RSI maintaining a bullish range for ~18 years.
Importantly, overbought RSI levels during strong trends signal momentum, not necessarily exhaustion. Early in my work, I underestimated overbought conditions, expecting reversals that often never came. Recognizing them instead as signs of strength was a major mindset shift.
Practical Takeaways
Final Thoughts
The RSI remains a cornerstone of technical analysis, but its true power emerges when applied with nuance. By understanding RSI range rules, recognizing divergence, and contextualizing overbought/oversold signals, traders and investors can sharpen their edge across market environments.
Personally, I continue to rely on these principles every day as part of my technical process — proof that some lessons, once learned, remain valuable for a lifetime.
—
Originally posted 9th May 2025
Investopedia.com: The comments, opinions and analyses expressed herein are for informational purposes only and should not be considered individual investment advice or recommendations to invest in any security or to adopt any investment strategy. While we believe the information provided herein is reliable, we do not warrant its accuracy or completeness. The views and strategies described on our content may not be suitable for all investors. Because market and economic conditions are subject to rapid change, all comments, opinions and analyses contained within our content are rendered as of the date of the posting and may change without notice. The material is not intended as a complete analysis of every material fact regarding any country, region, market, industry, investment or strategy. This information is intended for US residents only.
Information posted on IBKR Campus that is provided by third-parties does NOT constitute a recommendation that you should contract for the services of that third party. Third-party participants who contribute to IBKR Campus are independent of Interactive Brokers and Interactive Brokers does not make any representations or warranties concerning the services offered, their past or future performance, or the accuracy of the information provided by the third party. Past performance is no guarantee of future results.
This material is from Investopedia and is being posted with its permission. The views expressed in this material are solely those of the author and/or Investopedia and Interactive Brokers is not endorsing or recommending any investment or trading discussed in the material. This material is not and should not be construed as an offer to buy or sell any security. It should not be construed as research or investment advice or a recommendation to buy, sell or hold any security or commodity. This material does not and is not intended to take into account the particular financial conditions, investment objectives or requirements of individual customers. Before acting on this material, you should consider whether it is suitable for your particular circumstances and, as necessary, seek professional advice.
Related Articles


Join The Conversation
For specific platform feedback and suggestions, please submit it directly to our team using these instructions.
If you have an account-specific question or concern, please reach out to Client Services.
We encourage you to look through our FAQs before posting. Your question may already be covered!