
- Solve real problems with our hands-on interface
- Progress from basic puts and calls to advanced strategies
Interactive Options Course
Posted July 19, 2024 at 10:48 am
From SIA Charts
1/ Kinross Gold Corp. – (K.TO)
2/ Candlestick Chart
3/ Point and Figure Chart
Investopedia is partnering with CMT Association on this newsletter. The contents of this newsletter are for informational and educational purposes only, however, and do not constitute investing advice. The guest authors, which may sell research to investors, and may trade or hold positions in securities mentioned herein do not represent the views of CMT Association or Investopedia. Please consult a financial advisor for investment recommendations and services.
Kinross Gold Corp. – (K.TO)
Courtesy of SIA Charts
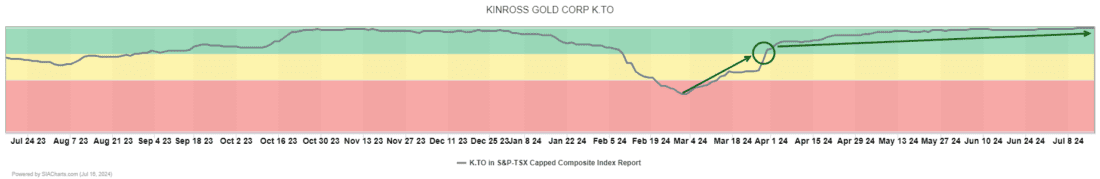
SIA Charts’ relative strength rankings help investors manage risk by identifying stocks and sectors which are underperforming or starting to underperform relative to their peers and/or their benchmarks indicating that capital is moving elsewhere.
With the price of Gold rallying to new all-time highs again this month, stocks of gold producers have been attracting continued interest. Kinross Gold* (K.TO) is the strongest ranked stock not only in the gold sector, but in all of Canada, holding down top spot in both the SIA S&P/TSX 60 Index Report (a spot it has held since May) and the SIA S&P/TSX Composite Index Report (a place it reached last week). Since returning to the Green Favored Zone at the end of March, Kinross Gold is up 54.0%, while the S&P/TSX Composite Index is up 3.7%
Candlestick Chart
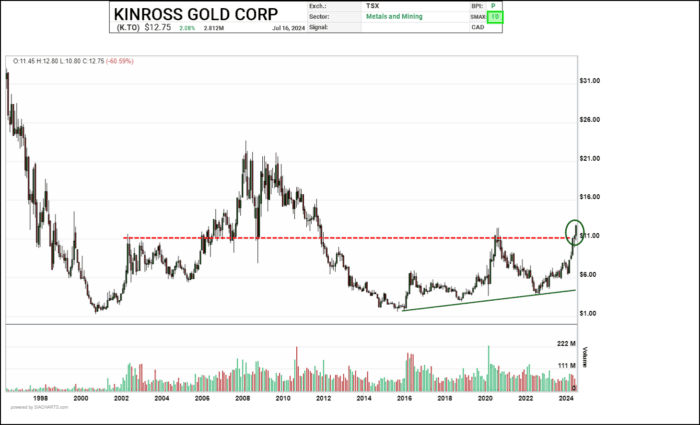
At the Daily Stock Report, we usually look at short to medium-term price action but it also can be helpful to look at really long-term charts to put more recent moves into context. This monthly chart, which goes back more than 25 years, shows that although Kinross Gold (K.TO) has staged a big rally recently, in a longer term context, it has just broken out of a big base clearing $11.00 and its recovery trend appears to be just getting started.
Next potential upside resistance for Kinross appears near the $15.00 round number, then previous highs near $16.00. The $11.00 breakout point reverses polarity to become initial support.
*Shares of Kinross Gold are held in portfolios managed by SIA Wealth Management.

Courtesy of SIA Charts
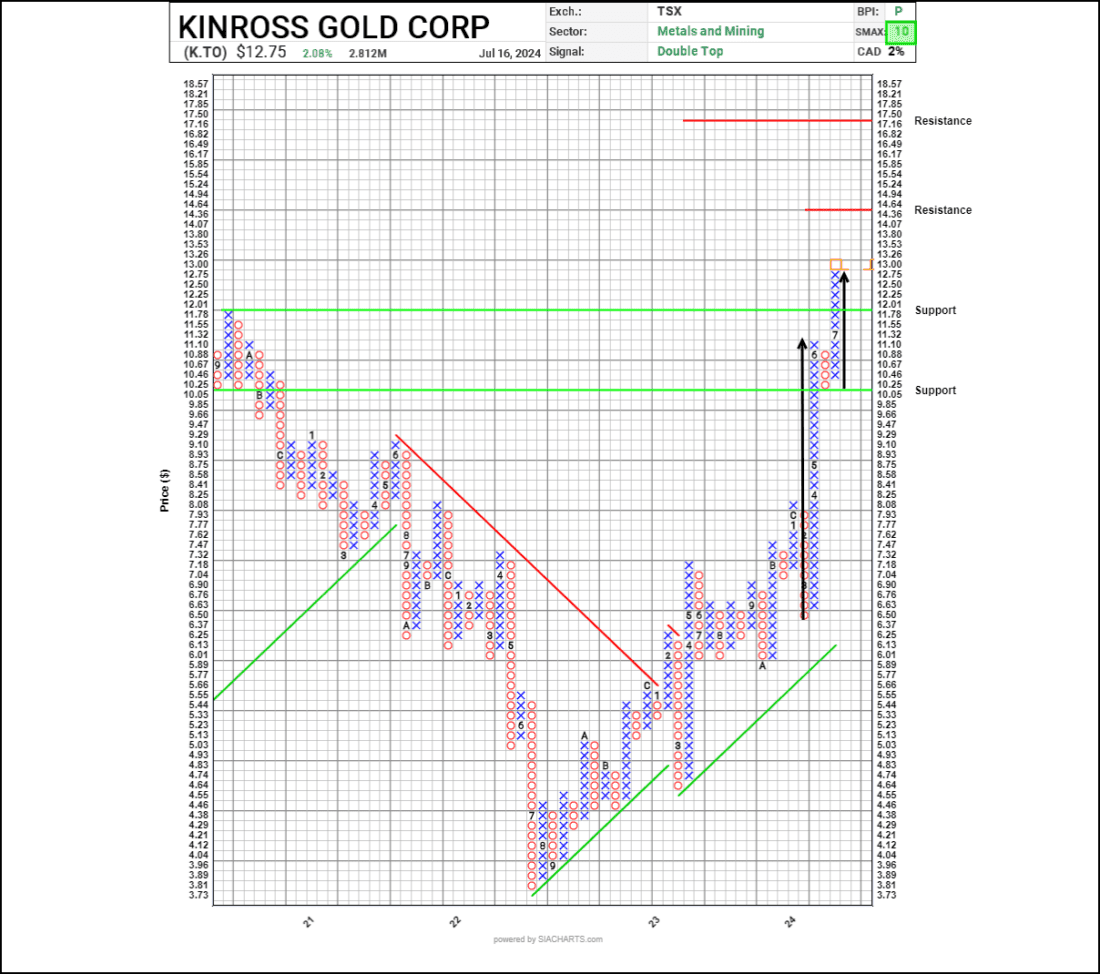
Kinross Gold bottomed out in the summer of 2022 and broke out of a downtrend at the start of 2023. The first phase of the current uptrend was a steady advance through to March of this year. In recent months, accumulation has accelerated dramatically. A large High Pole rally was followed by a small four box correction, then the start of a new upleg with a bullish Double Top combining with a previous breakout to form a Bullish Catapult, followed by a rally to new five-year highs.
Next potential upside resistance may appear near $14.65 based on a horizontal count, followed by $17.50 based on a vertical count. Initial support appears near $11.75 based on a 3-box reversal and a retest of a recent breakout point.
Point and Figure Chart
With a perfect SMAX score (which is a near-term 1 to 90-day indicator comparing an asset against different equal-weight asset classes) of 10 out of 10, K.TO is exhibiting short-term strength across the asset classes.
Courtesy of SIA Charts
—
Originally posted 19th July 2024
Investopedia.com: The comments, opinions and analyses expressed herein are for informational purposes only and should not be considered individual investment advice or recommendations to invest in any security or to adopt any investment strategy. While we believe the information provided herein is reliable, we do not warrant its accuracy or completeness. The views and strategies described on our content may not be suitable for all investors. Because market and economic conditions are subject to rapid change, all comments, opinions and analyses contained within our content are rendered as of the date of the posting and may change without notice. The material is not intended as a complete analysis of every material fact regarding any country, region, market, industry, investment or strategy. This information is intended for US residents only.
Information posted on IBKR Campus that is provided by third-parties does NOT constitute a recommendation that you should contract for the services of that third party. Third-party participants who contribute to IBKR Campus are independent of Interactive Brokers and Interactive Brokers does not make any representations or warranties concerning the services offered, their past or future performance, or the accuracy of the information provided by the third party. Past performance is no guarantee of future results.
This material is from Investopedia and is being posted with its permission. The views expressed in this material are solely those of the author and/or Investopedia and Interactive Brokers is not endorsing or recommending any investment or trading discussed in the material. This material is not and should not be construed as an offer to buy or sell any security. It should not be construed as research or investment advice or a recommendation to buy, sell or hold any security or commodity. This material does not and is not intended to take into account the particular financial conditions, investment objectives or requirements of individual customers. Before acting on this material, you should consider whether it is suitable for your particular circumstances and, as necessary, seek professional advice.
Related Articles


Join The Conversation
For specific platform feedback and suggestions, please submit it directly to our team using these instructions.
If you have an account-specific question or concern, please reach out to Client Services.
We encourage you to look through our FAQs before posting. Your question may already be covered!