
- Solve real problems with our hands-on interface
- Progress from basic puts and calls to advanced strategies
Interactive Options Course

Posted May 2, 2025 at 8:52 am
From SIA Charts
1/ FedEx Corp. (FDX)
2/ Candlestick Chart
3/ Point and Figure Chart
Investopedia is partnering with CMT Association on this newsletter. The contents of this newsletter are for informational and educational purposes only, however, and do not constitute investing advice. The guest authors, which may sell research to investors, and may trade or hold positions in securities mentioned herein do not represent the views of CMT Association or Investopedia. Please consult a financial advisor for investment recommendations and services.
FedEx Corp. (FDX)
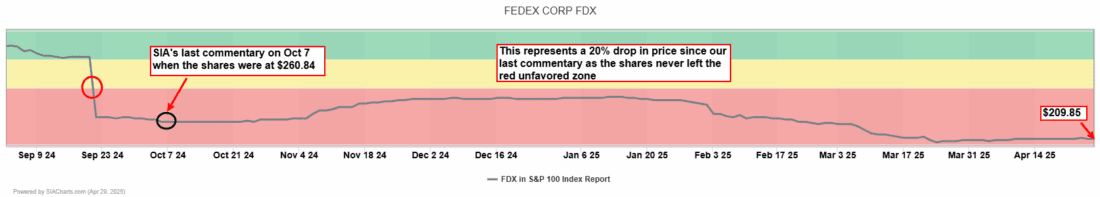
The last time we highlighted FedEx Corp. (FDX) in our Daily Stock Report was on October 7, 2024, when the shares were at $260.84. The shares had just entered the red unfavored zone of the SIA S&P 100 Index report shortly before that report was published. Since then, the shares have continued to weaken further as the closing price is now at $209.85 which represents a 20% drop since the October 4, 2024, closing price.
This serves as another strong example of the importance of avoiding investments in the red Unfavored Zone. Many advisors may instinctively gravitate toward names in this zone under the assumption that they are oversold and present a “value buy” opportunity. However, what may appear to be a value buy can often turn out to be a “value trap,” where shares continue to decline—a scenario that has clearly played out in this case.
This reinforces SIA’s methodology not to pursue a “contrarian” mindset as names in the unfavored zone are not exhibiting any relative strength as the sellers are in control and not many market participants are looking at the name. The SIA Charts relative strength rankings help advisors identify stocks that are not just outperforming peers or index benchmarks, but in this case also underperforming peers or index benchmarks with such underperformance often signaling deteriorating investor expectations for company or sector growth. Currently, FDX resides in the #97 spot in the SIA S&P 100 Index report, down 30 spots in the last quarter.
Candlestick Chart
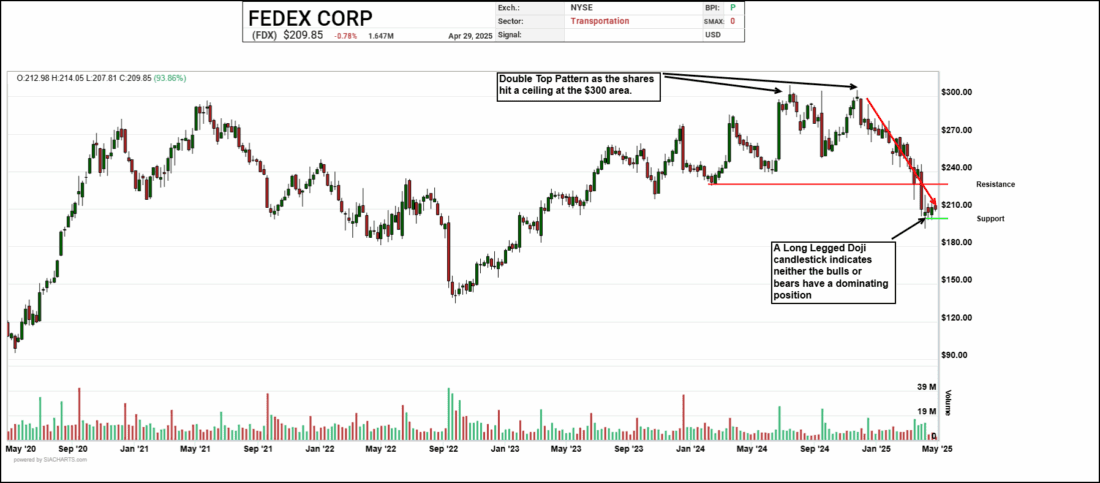
Let’s dive in and see what the candlestick chart looks like to investigate what may lie ahead for FedEx Corp. Back in July of 2024, and November of 2024, we see a classic double top pattern where the shares bumped its head at the $300.00 level before a sustained downtrend materialized. In our last commentary in October, we identified $250 and the $231 as possible support levels but those did not hold. Of note, we see a long-legged doji candlestick appear which comprises long upper and lower shadows and the open and close prices of the security fall approximately close to one another. This formation signifies indecision in the market, where neither bulls nor bears dominate, and demand and supply are relatively balanced. As such, with the appearance of this candlestick, the $200 whole number support level is possible. To the upside, resistance is at $230 as prior support now becomes new resistance.
Point and Figure Chart
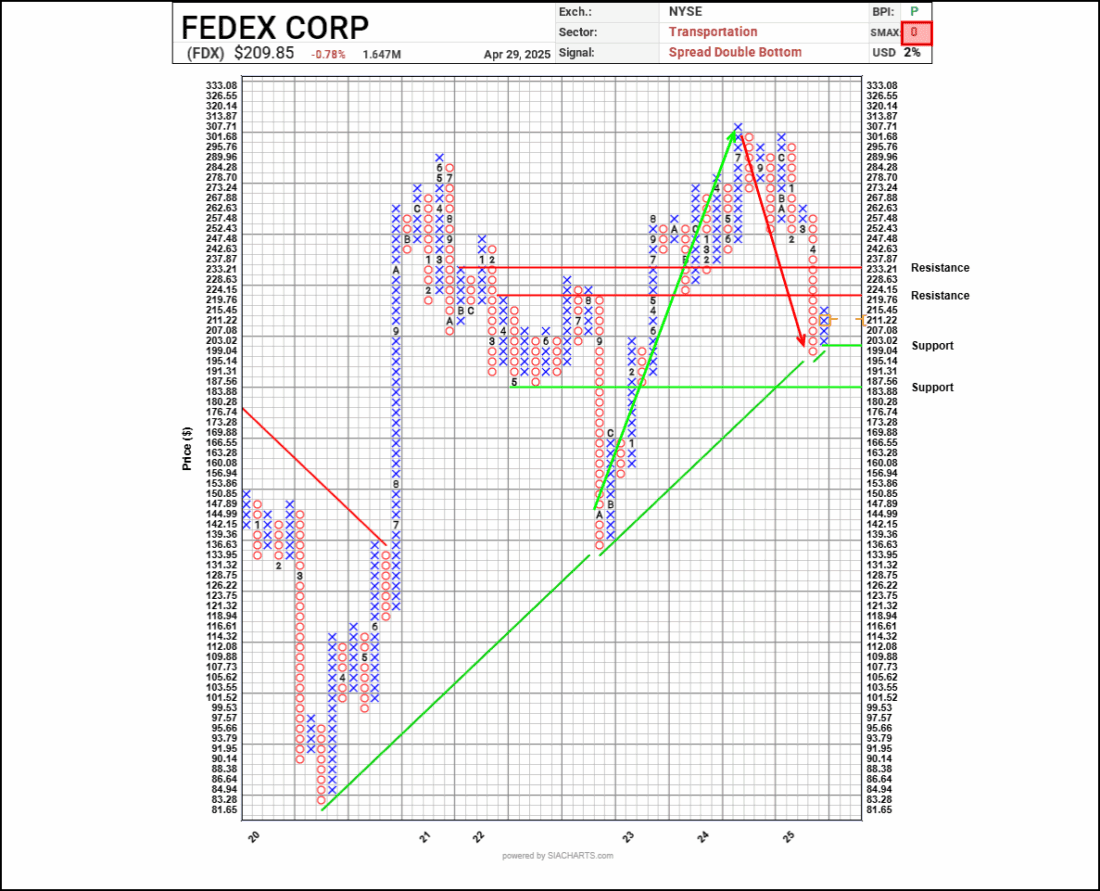
In looking at the Point and Figure chart we see a steady uptrend in place as of late 2022, up until the shares hit its top in July of last year. Since the summer top, the shares started to wane as a pattern of lower lows started to materialize into the fall, which has continued into this year. The most significant drop occurring earlier this month before finally finding a potential floor at the long term uptrend line at the $199.00 area. The shares are currently in a rising column of 4 X’s trying to regain some traction; however, there is currently no short-term strength whatsoever as the SMAX score is a 0 out of 10. Support can be found at its 3-box reversal of $199.04, which also coincides with the long-term uptrend line and proximity to the $200 psychological number. If this important support level does not hold, then next support is at $183.88. To the upside, If the shares can manage to rally further, resistance is at $224.15 and above that, $237.87.
—
Originally posted 1st May 2025
Investopedia.com: The comments, opinions and analyses expressed herein are for informational purposes only and should not be considered individual investment advice or recommendations to invest in any security or to adopt any investment strategy. While we believe the information provided herein is reliable, we do not warrant its accuracy or completeness. The views and strategies described on our content may not be suitable for all investors. Because market and economic conditions are subject to rapid change, all comments, opinions and analyses contained within our content are rendered as of the date of the posting and may change without notice. The material is not intended as a complete analysis of every material fact regarding any country, region, market, industry, investment or strategy. This information is intended for US residents only.
Information posted on IBKR Campus that is provided by third-parties does NOT constitute a recommendation that you should contract for the services of that third party. Third-party participants who contribute to IBKR Campus are independent of Interactive Brokers and Interactive Brokers does not make any representations or warranties concerning the services offered, their past or future performance, or the accuracy of the information provided by the third party. Past performance is no guarantee of future results.
This material is from Investopedia and is being posted with its permission. The views expressed in this material are solely those of the author and/or Investopedia and Interactive Brokers is not endorsing or recommending any investment or trading discussed in the material. This material is not and should not be construed as an offer to buy or sell any security. It should not be construed as research or investment advice or a recommendation to buy, sell or hold any security or commodity. This material does not and is not intended to take into account the particular financial conditions, investment objectives or requirements of individual customers. Before acting on this material, you should consider whether it is suitable for your particular circumstances and, as necessary, seek professional advice.
Related Articles


Join The Conversation
For specific platform feedback and suggestions, please submit it directly to our team using these instructions.
If you have an account-specific question or concern, please reach out to Client Services.
We encourage you to look through our FAQs before posting. Your question may already be covered!