
- Solve real problems with our hands-on interface
- Progress from basic puts and calls to advanced strategies
Interactive Options Course

Posted March 12, 2025 at 7:03 am
1/ Medium-Term Market Trend Model Turns Bearish
2/ 5500 Becomes Minimum Downside Target For S&P 500
3/ Breadth Conditions Continue to Deteriorate
Investopedia is partnering with CMT Association on this newsletter. The contents of this newsletter are for informational and educational purposes only, however, and do not constitute investing advice. The guest authors, which may sell research to investors, and may trade or hold positions in securities mentioned herein do not represent the views of CMT Association or Investopedia. Please consult a financial advisor for investment recommendations and services.
Medium-Term Market Trend Model Turns Bearish
Our proprietary Market Trend Model turned bearish last Friday on the medium-term time frame for the first time since October 2023. While our long-term model remains bullish, suggesting the secular trend still remains intact, this bearish signal on the medium-term time frame tells us to focus more on capital preservation than capital growth.
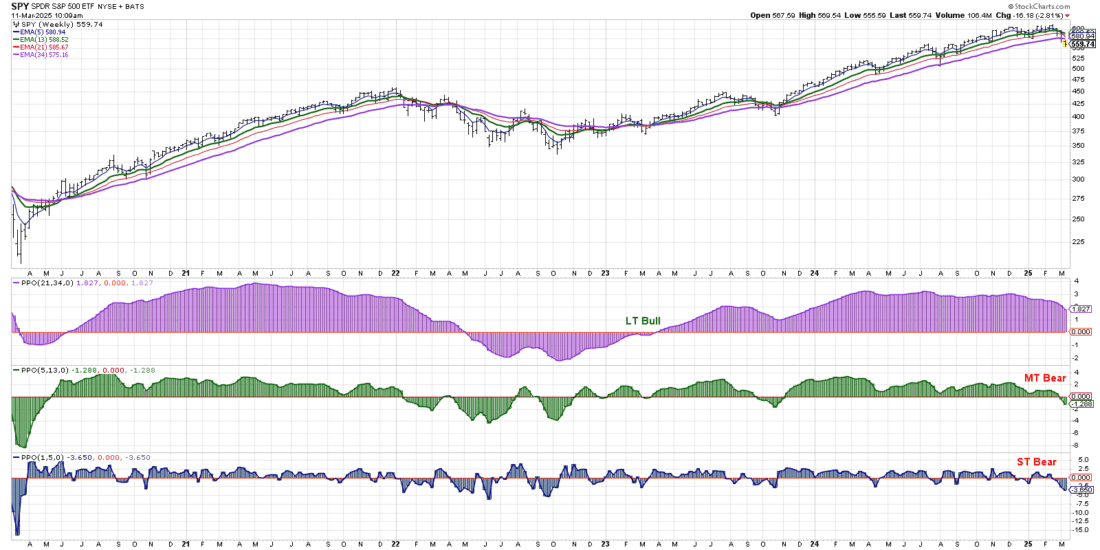
Note how in 2024 we had five different bearish signals on the short-term time frame, yet the medium-term trend model remained bullish through the entire calendar year. This configuration represented a buyable pullback within a cyclical uptrend, since the medium-term and long-term trends remained firmly in the bullish range.
While we’ve been tracking rotations in market leadership, as well as bearish momentum and breadth divergences since November 2024, the continued bullish reading on the medium-term trend model helped us remain constructive into Q1 2025. There’s no guarantee that we’ll see a repeat of 2022 or any other bear market year, but the fact remains that the trends in 2025 are starting to very much diverge from the bullish path of 2024.
5500 Becomes Minimum Downside Target For S&P 500
After Monday’s step selloff to start the week, the S&P 500 index is now down almost 10% from its most recent all-time high around 6150. This means that the current pullback is basically in line with the July 2024 drawdown in terms of price and time.
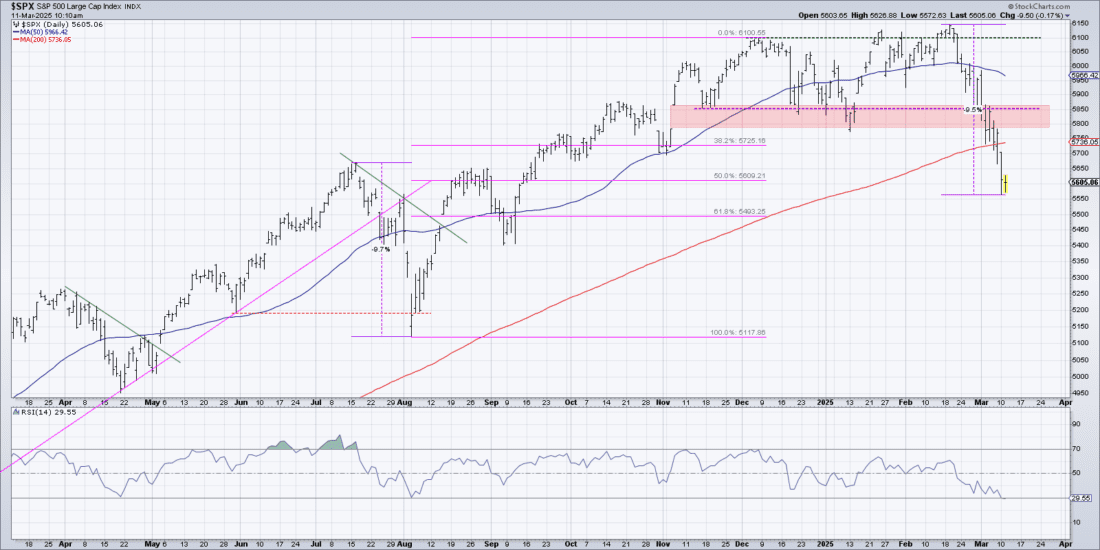
With the key support level of 5850 in the rearview mirror, and with the 200-day moving average violated on Monday, we have established an initial downside target of 5500. That would represent a 61.8% Fibonacci retracement of the August 2024 to December 2024 uptrend phase, where we would expect at least some sort of countertrend bounce.
The 200-day moving average now becomes resistance above the current price action, and given that the S&P 500 reached an RSI oversold condition for the first time since the August low, we would be looking for other signs of short-term capitulation starting this week.
Breadth Conditions Continue to Deteriorate
Up through the end of last week, some of our longer-term breadth indicators remained bullish, but Monday’s selloff appears to have taken one more breadth indicator off the “still bullish” list. With less than 50% of S&P 500 members remaining above their 200-day moving average, we can now add “lack of breadth support” to the list of bearish market characteristics.
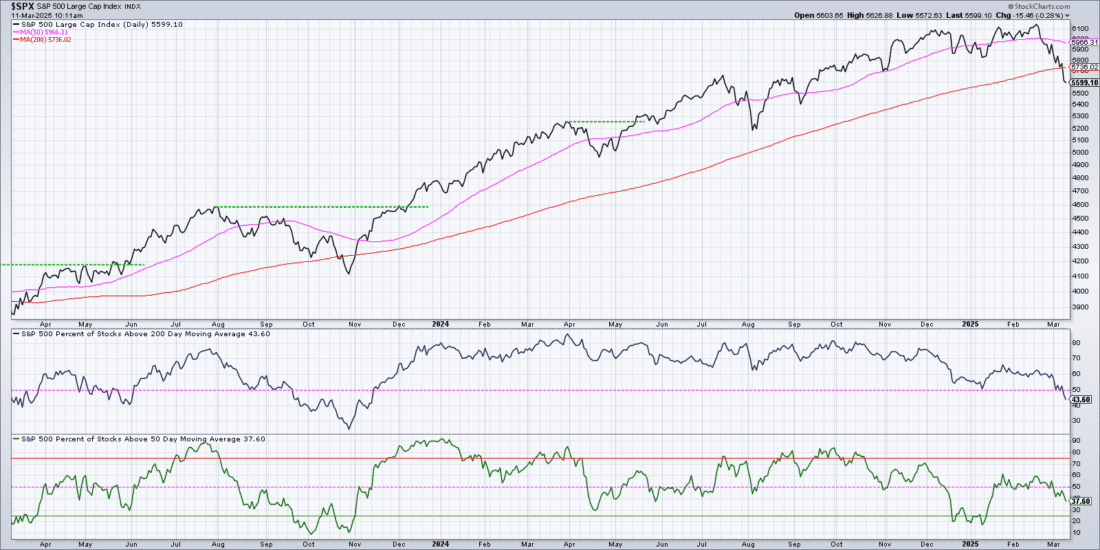
Going back to August 2024, that initial pullback from SPX 4600 appeared to be a minor pullback as this market breadth indicator remained above 50%. With most S&P 500 stocks still above their long-term trend barometer, how bearish could things really be?
Then in mid-September, we saw the indicator push below 50% as the S&P 500 made a new swing low. The market ended up going lower for another six weeks before eventually finding a bottom just above 4100 in late October. Now with less than 50% of S&P 500 members remaining above their 200-day, the current corrective phase is beginning to look more like a major correction as opposed to a tactical pullback.
—
Originally posted 11th March 2025
Investopedia.com: The comments, opinions and analyses expressed herein are for informational purposes only and should not be considered individual investment advice or recommendations to invest in any security or to adopt any investment strategy. While we believe the information provided herein is reliable, we do not warrant its accuracy or completeness. The views and strategies described on our content may not be suitable for all investors. Because market and economic conditions are subject to rapid change, all comments, opinions and analyses contained within our content are rendered as of the date of the posting and may change without notice. The material is not intended as a complete analysis of every material fact regarding any country, region, market, industry, investment or strategy. This information is intended for US residents only.
Information posted on IBKR Campus that is provided by third-parties does NOT constitute a recommendation that you should contract for the services of that third party. Third-party participants who contribute to IBKR Campus are independent of Interactive Brokers and Interactive Brokers does not make any representations or warranties concerning the services offered, their past or future performance, or the accuracy of the information provided by the third party. Past performance is no guarantee of future results.
This material is from Investopedia and is being posted with its permission. The views expressed in this material are solely those of the author and/or Investopedia and Interactive Brokers is not endorsing or recommending any investment or trading discussed in the material. This material is not and should not be construed as an offer to buy or sell any security. It should not be construed as research or investment advice or a recommendation to buy, sell or hold any security or commodity. This material does not and is not intended to take into account the particular financial conditions, investment objectives or requirements of individual customers. Before acting on this material, you should consider whether it is suitable for your particular circumstances and, as necessary, seek professional advice.
Any discussion or mention of an ETF is not to be construed as recommendation, promotion or solicitation. All investors should review and consider associated investment risks, charges and expenses of the investment company or fund prior to investing. Before acting on this material, you should consider whether it is suitable for your particular circumstances and, as necessary, seek professional advice.
Related Articles


Join The Conversation
For specific platform feedback and suggestions, please submit it directly to our team using these instructions.
If you have an account-specific question or concern, please reach out to Client Services.
We encourage you to look through our FAQs before posting. Your question may already be covered!