1/ Weekly Chart
2/ Daily Chart
3/ $0.50 Kase Bar Chart
4/ USO Table Comparison
Investopedia is partnering with CMT Association on this newsletter. The contents of this newsletter are for informational and educational purposes only, however, and do not constitute investing advice. The guest authors, which may sell research to investors, and may trade or hold positions in securities mentioned herein do not represent the views of CMT Association or Investopedia. Please consult a financial advisor for investment recommendations and services.
1/
Weekly Chart
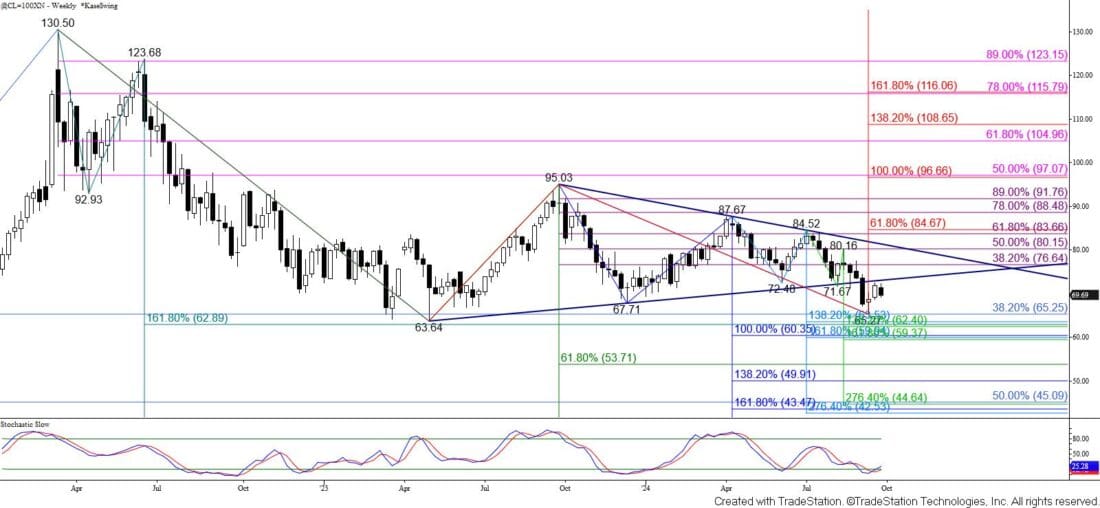
WTI crude oil is on the verge of adopting a much more bearish outlook for the coming months after breaking lower out of a pennant pattern and a subsequent throwback that has held the pennant’s lower trend line so far.
The weekly continuation chart broke lower out of a large pennant pattern on September 3 that began to form in early May 2023. The subsequent decline stalled at $65.27, which was in line with the 38 percent retracement of the rise from crude oil’s brief dip to the April 2020 swing low of $-40.32. This level at $65.3 has been resilient on the weekly chart since March of 2023.

Courtesy of TradeStation
A weekly long-legged doji formed and was completed by a close above the midpoint of the week ended September 6. This bullish candlestick pattern and a weekly oversold Stochastic oscillator warned that a reversal was taking place and that a failed breakout of the pennant had occurred.
However, the move up has held the lower trend line of the pennant and the pullback from the $72.49 swing high suggests that the move up from $65.27 is a throwback to challenge the pennant’s lower trend line. Throwbacks are common and typically prove to be a correction after breaking out of patterns such as this pennant.
Should this prove to be the case, and prices settle below the $65.3 target, WTI crude oil would then be poised to challenge $63.6 and a highly confluent area of Fibonacci wave extensions around $60.0. A sustained close below $60.0 would then call for targets at $53.7, $49.9, and another highly confluent area around $43.5.
2/
Daily Chart
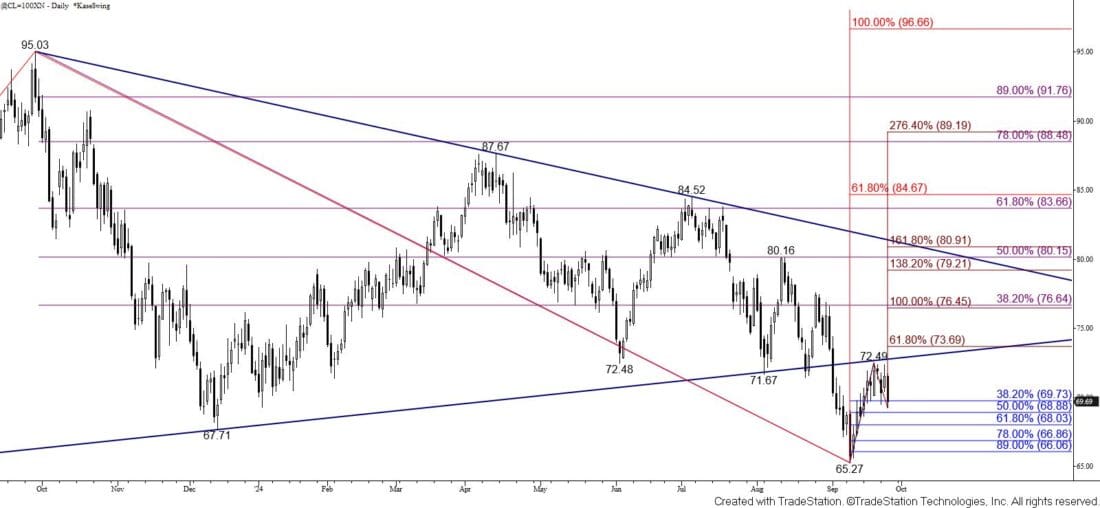
It is still premature to definitively state that the move up from $65.27 is complete. However, evidence that this move is a corrective throwback is mounting.
The $72.49 swing high held the lower trend line of the pennant, and the subsequent move down settled marginally below the 38 percent retracement of the rise from $65.27 (blue) on Wednesday. This implies that the decline from $72.49 is more than a simple correction of the move up from $65.27 and that a more significant test of support will take place during the next few days.

Courtesy of TradeStation
Settling below the 62 percent retracement of the rise from $65.27 (blue) at $68.0 would strongly suggest that the move up from $65.27 is complete and that WTI crude oil’s downtrend will rechallenge $65.3 and likely lower in the coming weeks.
Nonetheless, Wednesday’s close below the 38 percent retracement was nominal. This could prove to be a stalling point for the pullback from $72.49. Should prices rally again and close above the lower trend line of the pennant at $72.8, look for a test of the $73.7 smaller than (0.618) target of the wave up from $65.27 (dark red). This wave then connects to $76.5 and higher.
3/
$0.50 Kase Bar Chart
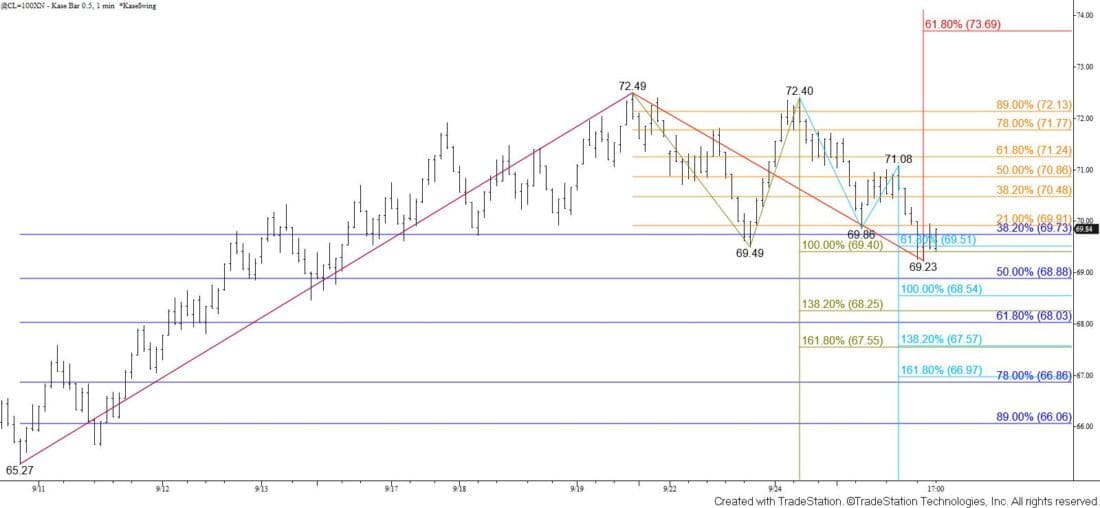
The intra-day $0.50 Kase Bar chart shows that the connection to the key $68.0 target is made through $69.5 and $68.5. These are the smaller than (0.618) and equal to (1.00) targets of the wave down from $72.40 (light blue). The $65.9 level is also the equal to (1.00) target of the primary wave down from $72.49 (olive). Falling back below $69.5 will call for $68.5, which then connects to $67.6. Therefore, closing below $68.5 will clear the way for a test of $68.0.

Courtesy of TradeStation
Nevertheless, because the $69.4 equal to (1.00) target of the primary wave down from $72.49 (olive) held there is a modest chance for another test of resistance. Closing above the 62 percent retracement of the decline from $72.49 (orange) at $71.2 would imply that the move down from $72.49 is complete and would clear the way for a test of the pennant’s lower trend line at $72.8 and then the $73.7 smaller than (0.618) target of the wave up from $65.27 (red).
4/
USO Table Comparison
WTI’s trend down from the March 2022 swing high of $130.50 is still intact. Breaking lower out of the pennant that began in March of 2023 indicates that the downtrend should extend in the coming weeks and months.
However, it is still unclear as to whether the move up from $65.27 is a corrective throwback or the early stage of a bullish reversal.
Based on the mounting bearish evidence that has formed within the past few days it looks as though the move up from $65.27 will prove to be a corrective throwback that holds the lower trend line of the pennant around $72.8.
Key support for the near-term is $68.0, a close below which will call for $67.0 and likely another test of $65.3. Settling below $65.3 will open the way for $63.6 and $60.0 within the next few weeks and possibly much lower in the coming months.

Courtesy of TradeStation
That said, settling above $71.2 before falling much lower will call for the lower trend line at $72.8 to be challenged again. Settling above this would infer that a bullish reversal is underway. This would be confirmed by a close above $73.7, which will open the way for $76.5 and high.
Equivalent targets and resistance levels for the USO ETF are also shown in the table above.
—
Originally posted 26th September 2024
Disclosure: Investopedia
Investopedia.com: The comments, opinions and analyses expressed herein are for informational purposes only and should not be considered individual investment advice or recommendations to invest in any security or to adopt any investment strategy. While we believe the information provided herein is reliable, we do not warrant its accuracy or completeness. The views and strategies described on our content may not be suitable for all investors. Because market and economic conditions are subject to rapid change, all comments, opinions and analyses contained within our content are rendered as of the date of the posting and may change without notice. The material is not intended as a complete analysis of every material fact regarding any country, region, market, industry, investment or strategy. This information is intended for US residents only.
Disclosure: Interactive Brokers Third Party
Information posted on IBKR Campus that is provided by third-parties does NOT constitute a recommendation that you should contract for the services of that third party. Third-party participants who contribute to IBKR Campus are independent of Interactive Brokers and Interactive Brokers does not make any representations or warranties concerning the services offered, their past or future performance, or the accuracy of the information provided by the third party. Past performance is no guarantee of future results.
This material is from Investopedia and is being posted with its permission. The views expressed in this material are solely those of the author and/or Investopedia and Interactive Brokers is not endorsing or recommending any investment or trading discussed in the material. This material is not and should not be construed as an offer to buy or sell any security. It should not be construed as research or investment advice or a recommendation to buy, sell or hold any security or commodity. This material does not and is not intended to take into account the particular financial conditions, investment objectives or requirements of individual customers. Before acting on this material, you should consider whether it is suitable for your particular circumstances and, as necessary, seek professional advice.
Disclosure: ETFs
Any discussion or mention of an ETF is not to be construed as recommendation, promotion or solicitation. All investors should review and consider associated investment risks, charges and expenses of the investment company or fund prior to investing. Before acting on this material, you should consider whether it is suitable for your particular circumstances and, as necessary, seek professional advice.
Disclosure: Futures Trading
Futures are not suitable for all investors. The amount you may lose may be greater than your initial investment. Before trading futures, please read the CFTC Risk Disclosure. A copy and additional information are available at ibkr.com.


Join The Conversation
For specific platform feedback and suggestions, please submit it directly to our team using these instructions.
If you have an account-specific question or concern, please reach out to Client Services.
We encourage you to look through our FAQs before posting. Your question may already be covered!