
- Solve real problems with our hands-on interface
- Progress from basic puts and calls to advanced strategies
Interactive Options Course

Posted February 13, 2025 at 12:55 pm
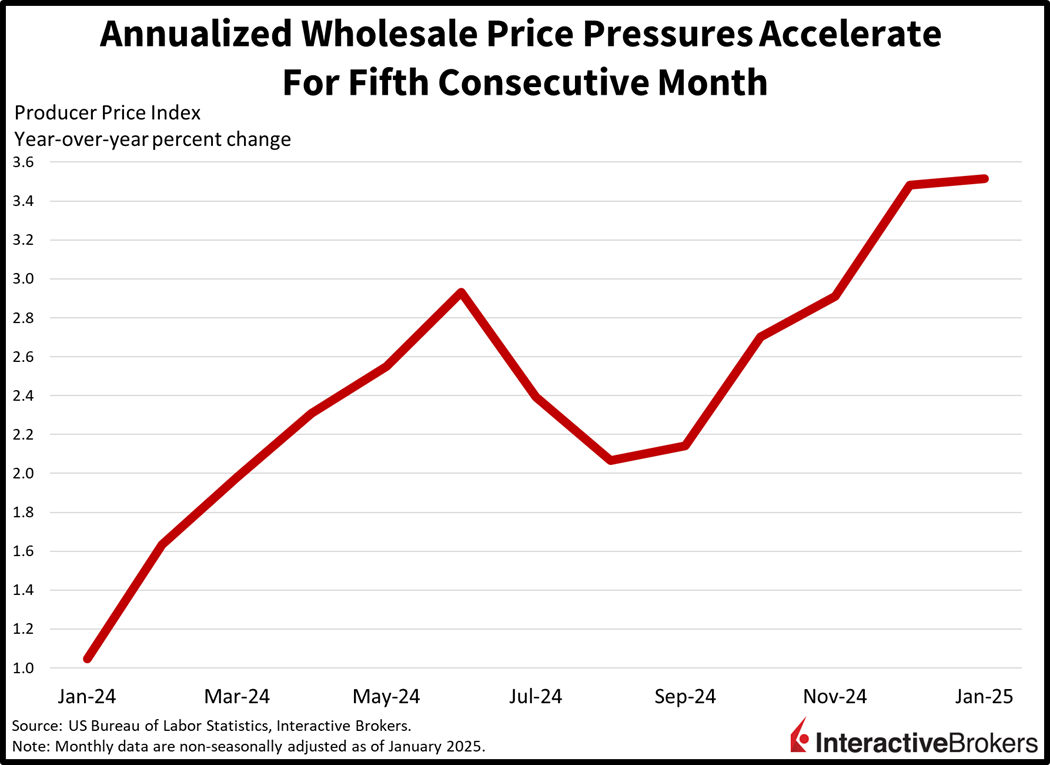
Markets are rallying despite a hotter-than-expected PPI report this morning depicting the fifth month in a row of annualized acceleration. The data release arrived ahead of President Trump’s planned afternoon announcement concerning reciprocal tariffs. Still, the wholesale inflation print served to quell investor anxiety stemming from yesterday’s scorching hot CPI, since it marked a modest monthly deceleration and some of the segments that are inputted into the PCE came in quite cool. But I think traders are jumping the gun here, especially against the backdrop of two back-to-back price pressure prints that flew past estimates. Furthermore, I’m forecasting a pickup in economic growth this year, driven by trade acquiescence, lighter taxation, milder regulations and policy measures that incentivize domestic manufacturing. The buoyant conditions in store are terrific for corporate earnings, but they aren’t necessarily conducive to disinflation.
A slower pace of cost increases for wholesale services offset an uptick in the goods category, which resulted in an overall moderation in January’s Producer Price Index (PPI). But folks, the 0.4% month-over-month (m/m) climb was not consistent with the Fed’s 2% inflation objective and arrived alongside a 3.5% year-over-year (y/y) advance for the gauge. The results blew past projections calling for 0.3% and 3.2% but were similar to December’s 0.5% and 3.5%. Moreover, the inflationary impulse was broad and widespread, with not one major category registering deflation. Services costs rose 0.3% m/m. The category is comprised of transportation and warehousing, other and trade, which experienced m/m sticker raises of 0.6%, 0.4% and 0.1%. Goods, meanwhile, accelerated to 0.6%, with energy and food sporting m/m cost pressure rates of 1.7% and 1.1%. Goods excluding food and energy only moved higher by 0.1%, however.
Unemployment claims declined slightly during the past two weeks, a result that points to the job market being well-anchored and continuing to be range-bound. Initial filings fell from 219,000 for the week ended February 8 to 213,000 during the subsequent seven-day timeframe and dropped below the estimate of 217,000. Continuing claims for the week ended February 1 dipped by 36,000 to 1.85 million. Meanwhile, the four-week averages for both metrics, which smooth out volatility in data, declined. Initial and continuing claims fell from 217,000 and 1.87 million to 216,000 and 1.85 million.
Asset prices are jumping with every major domestic equity benchmark trading north and interest rates paring a lot of yesterday’s move to the upside. The Nasdaq 100, S&P 500, Dow Jones Industrial and Russell 2000 indices are gaining 0.8%, 0.5%, 0.3% and 0.2% amidst strong sectoral breadth. Of the eleven major segments, 9 are higher as materials, technology and consumer discretionary lead; they’re up 1%, 0.9% and 0.9%. Utilities and industrials are comprising the day’s laggards; those are both trimming a modest 0.2%. Treasurys are getting scooped up too with the 2- and 10-year maturities changing hands at 4.32% and 4.54%, 4 and 9 basis points lighter on the session in bull-steepening fashion. Softer borrowing costs are weighing on the greenback, however, with its index down 53 bps as it depreciates relative to all of its major counterparts, which include the euro, pound sterling, franc, yen, yuan, loonie and Aussie dollar. The weaker US currency is helping commodities and copper, lumber, crude oil and gold. They are up 1.5%, 1.3%, 0.3% and 0.2% but silver is bucking the trend by losing 0.2%. WTI is trading at $71.38 and recovering from earlier losses on news that New Delhi is quickly looking for new supplies following fresh sanctions on Tehran and Moscow. A modest uptick in the demand outlook from the International Energy Agency is also helping to support the critical commodity.
Inflation can result from either reduced supply or rising demand pumping up prices. This year will offer us opportunities on both sides, with the potential increases in trade tensions limiting the availability of goods, while buoyant economic growth may overwhelm businesses with revenue opportunities. Considering we just got two back-to-back hot price pressure prints, tomorrow’s retail sales publication will be pivotal to see if last month’s impulse was indeed derived by robust customer activity. But Wall Street doesn’t think that’s the case, with the median forecast for tomorrow morning’s consumption gauge hovering at a negative 0.2%. However, IBKR Forecast Traders are of a different view and are expecting a positive figure in tomorrow’s 8:30 am ET US Census Bureau release. The numbers will certainly be interesting and will offer clues on whether or not the momentum is indeed being led by the supply side or the demand front. Finally, animal spirits are energetic in both markets and the economy, which has contributed to the Trump administration starting off its term with a 3% CPI figure. All is fine if that statistic fails to reach 3.5%, a level in which I believe will compel the Federal Reserve to turn around and begin hiking.

Source: ForecastEx
The UK posted slightly positive economic growth in the final quarter of last year that eked past expectations and was aided by a strong December. For the three-month period, preliminary data shows that gross domestic product (GDP) expanded 0.1% quarter over quarter (q/q) and 1.4% y/y compared to estimates of a 0.1% contraction and a 1.1% expansion. In the third quarter, GDP was flat q/q and up 1% y/y. In the recent quarter, services and construction were growth leaders, expanding 0.2% and 0.5% q/q, respectively, but business investment dropped 3.2%, much worse than the estimate for a 0.4% decline and the third quarter’s 1.9% increase.
Also in December, the country’s trade deficit dropped from £18.90 billion to £17.45 billion, compared to the estimate of £18.60 billion. In a surprise development, the monthly result pushed the fourth-quarter trade balance with the US into a deficit of £16.4 million.
Industrial production in Europe weakened during the final month of 2024, falling 1.1% m/m and 2% y/y, according to Eurostat. Production of non-durable consumer goods and energy climbed 5.2% and 0.6% m/m in December while the following sectors experienced the noted decreases:
Among countries, Ireland, Luxembourg and Croatia posted the largest increases while Germany, Italy, Austria, Portugal and Montenegro experienced the most significant contractions.
Japan’s Producer Price Index climbed 0.3% m/m and 4.2% y/y in January compared to 0.4% and 3.9% in the preceding month. The y/y increase relative to December’s result was driven by high prices of energy, rice, aluminum and other raw materials, according to preliminary data from the Bank of Japan. During the same month, export prices climbed 0.2% m/m and import prices rose 0.1%.
To learn more about ForecastEx, view our Traders’ Academy video here
New to Interactive Brokers?
Open AccountInformation posted on IBKR Campus that is provided by third-parties does NOT constitute a recommendation that you should contract for the services of that third party. Third-party participants who contribute to IBKR Campus are independent of Interactive Brokers and Interactive Brokers does not make any representations or warranties concerning the services offered, their past or future performance, or the accuracy of the information provided by the third party. Past performance is no guarantee of future results.
This material is from IBKR Macroeconomics, an affiliate of Interactive Brokers LLC, and is being posted with its permission. The views expressed in this material are solely those of the author and/or IBKR Macroeconomics and Interactive Brokers is not endorsing or recommending any investment or trading discussed in the material. This material is not and should not be construed as an offer to buy or sell any security. It should not be construed as research or investment advice or a recommendation to buy, sell or hold any security or commodity. This material does not and is not intended to take into account the particular financial conditions, investment objectives or requirements of individual customers. Before acting on this material, you should consider whether it is suitable for your particular circumstances and, as necessary, seek professional advice.
Interactive Brokers LLC is a CFTC-registered Futures Commission Merchant and a clearing member and affiliate of ForecastEx LLC (“ForecastEx”). ForecastEx is a CFTC-registered Designated Contract Market and Derivatives Clearing Organization. Interactive Brokers LLC provides access to ForecastEx Forecast Contracts for eligible customers. Interactive Brokers LLC does not make recommendations with respect to any products available on its platform, including those offered by ForecastEx.
This is commentary on economic, political and/or market conditions within the meaning of CFTC Regulation 1.71, and is not meant provide sufficient information upon which to base a decision to enter into a derivatives transaction.
Related Articles


Join The Conversation
For specific platform feedback and suggestions, please submit it directly to our team using these instructions.
If you have an account-specific question or concern, please reach out to Client Services.
We encourage you to look through our FAQs before posting. Your question may already be covered!