
- Solve real problems with our hands-on interface
- Progress from basic puts and calls to advanced strategies
Interactive Options Course

Posted July 21, 2026 at 1:35 pm
There was a fair amount of recent commentary about the Philadelphia Semiconductor Index (SOX) entering bear market territory after pulling back 20% from its June 22nd high. Personally, I have a significant problem with the mechanical construct of -10% and -20% declines signifying a correction and a bear market, respectively. Those numbers make sense when discussing broad market moves but have much less relevance for narrow-based measures.
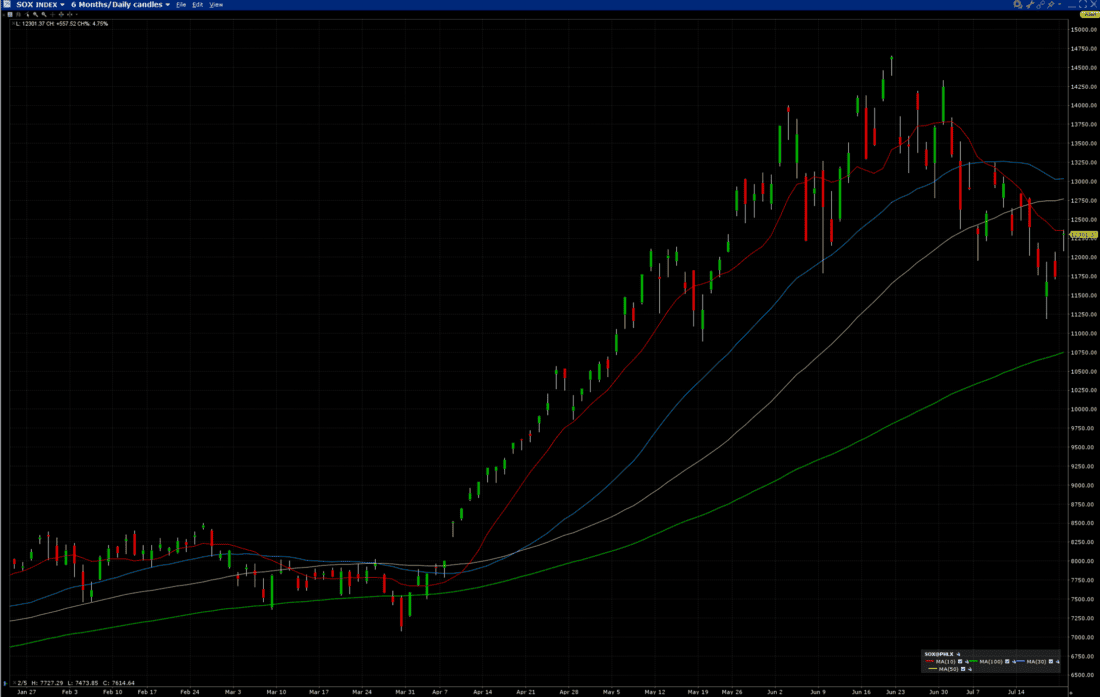
Let’s start with a visual. Does this look like a bear market to you?
SOX, 6-Months, Daily Candles with 10-day (red), 30-day (blue), 50-day (yellow), and 100-day (green) Moving Averages
Source: Interactive Brokers
Might one credibly argue that this looks like a topping pattern or be concerned that shorter-term moving averages have turned lower? Certainly. But we still see longer-term moving averages pointing higher, and that upward sloping 100-day moving average remains about 15% below the current index level.
More importantly, can an index that remains more than 70% up in just over 3 months be considered a bear market even if it pulls back 20% from its highs? I contend that it is hardly appropriate.
A bear market is more a state of mind than an arbitrary mathematical cutoff. Bear markets are accompanied by a feeling of existential dread, or a sense that little good can come from investing, and in a true bear market, those feelings persist for an extended period. One of my early bosses said to me that a good day in a bear market is when we close off our lows.
Quite frankly, the vast majority of younger and newer investors have never experienced a true, prolonged bear market. Indeed, we had significant pullbacks during 2022 and 2018 (the last two midterm election years), but they were measured in months, not years. The Covid bear market was the result of existential dread, but it was short-lived, thanks to massive fiscal and monetary stimulus. The last true bear markets were in the 2007-2009 (Global Financial Crisis) and the 2000-2002 (Internet Bubble) periods. Frankly speaking, if you are a US investor and weren’t in the markets during those events, you have not experienced a bear market. They used to happen with some regularity, but we have been blessed with expansionary financial conditions, a deft Federal Reserve, and investor psychology that have kept long bear markets at bay.
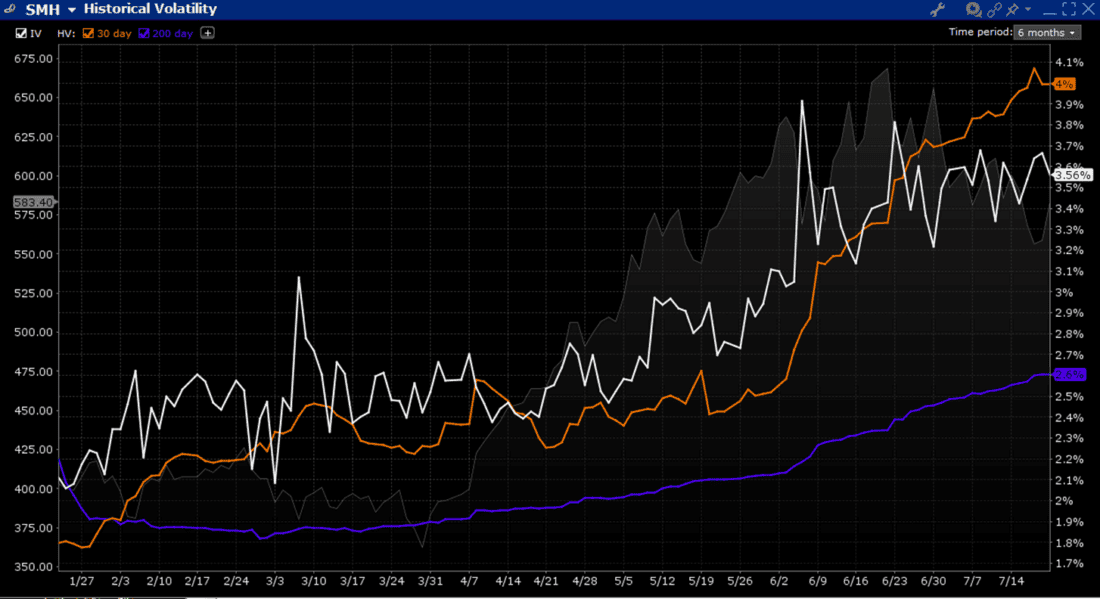
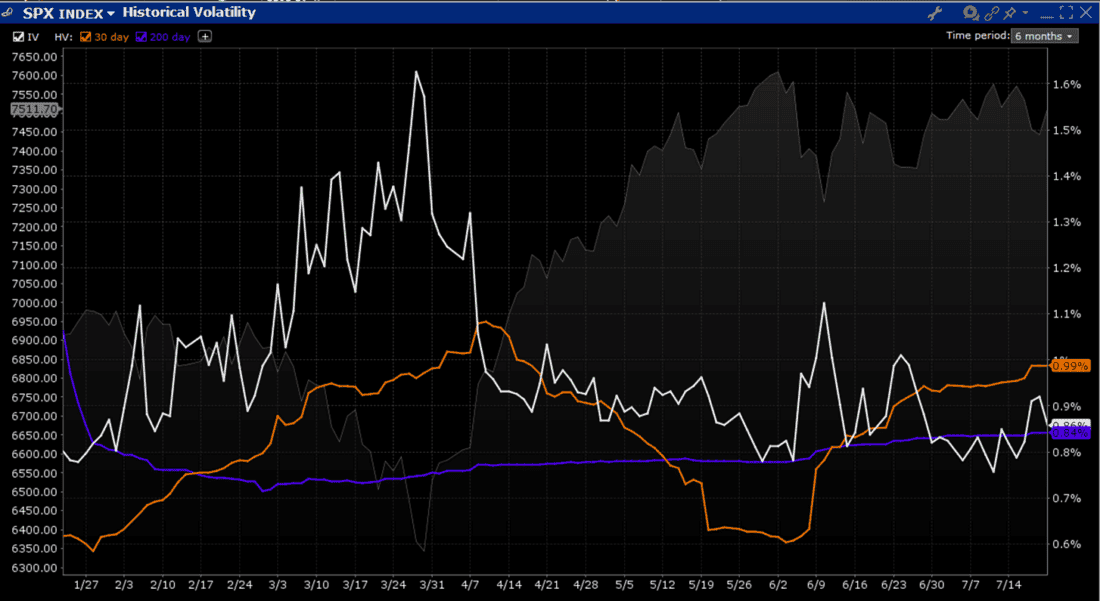
As for the 20% definition: we need to take into account the normal volatility of a market before arbitrarily declaring whether it’s in a bear (or bull) phase. Note that the historical volatility of a semiconductor proxy (SMH, since SOX does not have listed options) is much higher than that of the S&P 500 (SPX). On a long-term basis (200 days), SMH’s volatility is more than 3x higher than SPX, and in recent weeks it has been about 4x higher. If 20% is rightly considered extreme for SPX, it is hardly as noteworthy for semiconductor stocks.
SMH, 6-Month Chart: 30-Day (orange) and 200-day (blue) Historical Volatilities, with Implied Volatility (white)
SPX, 6-Month Chart: 30-Day (orange) and 200-day (blue) Historical Volatilities, with Implied Volatility (white
While I’m highly dismissive of calling the recent drop in SOX a bear market, today’s bounce is certainly welcomed by those who are long semiconductor shares. As of now, we are only back to the index’s 10-day moving average, though, meaning that it is too early to call this a definitive turnaround. But remember, since bear market rallies tend to be short, sharp, and ferocious, maybe those who are trading from the long side should hope for that characterization for a few days.
New to Interactive Brokers?
Open AccountAlready an Interactive Brokers Client?
Request Trading PermissionThe analysis in this material is provided for information only and is not and should not be construed as an offer to sell or the solicitation of an offer to buy any security. To the extent that this material discusses general market activity, industry or sector trends or other broad-based economic or political conditions, it should not be construed as research or investment advice. To the extent that it includes references to specific securities, commodities, currencies, or other instruments, those references do not constitute a recommendation by IBKR to buy, sell or hold such investments. This material does not and is not intended to take into account the particular financial conditions, investment objectives or requirements of individual customers. Before acting on this material, you should consider whether it is suitable for your particular circumstances and, as necessary, seek professional advice.
The views and opinions expressed herein are those of the author and do not necessarily reflect the views of Interactive Brokers, its affiliates, or its employees.
Any discussion or mention of an ETF is not to be construed as recommendation, promotion or solicitation. All investors should review and consider associated investment risks, charges and expenses of the investment company or fund prior to investing. Before acting on this material, you should consider whether it is suitable for your particular circumstances and, as necessary, seek professional advice.
Related Articles

















Join The Conversation
For specific platform feedback and suggestions, please submit it directly to our team using these instructions.
If you have an account-specific question or concern, please reach out to Client Services.
We encourage you to look through our FAQs before posting. Your question may already be covered!