
- Solve real problems with our hands-on interface
- Progress from basic puts and calls to advanced strategies
Interactive Options Course

Posted September 28, 2026 at 12:40 pm

Last updated: September 28, 2026 (originally published on May 7, 2025)
yfscreen is a package that provides simple and efficient access to Yahoo Finance’s screener API (https://finance.yahoo.com/research-hub/screener/) for querying and retrieving financial data.
The core functionality of the yfscreen package abstracts the complexities of interacting with Yahoo Finance APIs, such as session management, crumb and cookie handling, query construction, pagination, and JSON payload generation. This abstraction allows users to focus on filtering and retrieving data rather than managing API details. Use cases include screening across a range of security types:
The package supports advanced query capabilities, including logical operators, nested filters, and customizable payloads. It automatically handles pagination for efficient retrieval of large datasets by fetching results in batches of up to 250 entries per request. Filters are defined as lists of conditions to accommodate a wide range of screens.
The implementation uses standard HTTP libraries to handle API interactions efficiently and supports both R and Python to make it accessible for a broad audience.
install.packages("yfscreen")# install.packages("pak")
pak::pak("jasonjfoster/screen/r")library(yfscreen)
pip install yfscreen
pip install \
  git+https://github.com/jasonjfoster/screen.git@main#subdirectory=python
import yfscreen as yfs
Load the package and explore the available filter options using yfscreen::data_filters in R or yfs.data_filters in Python:
| Security types | Data types | Field names |
| equity | Market Data | eodprice |
| mutualfund | Ratios | exchange |
| etf | Performance | intradayprice |
| index | ⋮ | ⋮ |
| future | Technicals | ticker |
The yfscreen::create_query function in R and yfs.create_query function in Python create a structured query with logical operations and nested conditions formatted for the Yahoo Finance API.
Parameters
Value
A nested list representing the structured query with logical operations and nested conditions formatted for the Yahoo Finance API.
Examples
R
most_actives <- list(
  list("eq", list("region", "us")),
  list("btwn", list("intradaymarketcap", 2e9, 1e11)),
  list("gt", list("dayvolume", 5e6))
)
query <- yfscreen::create_query(most_actives)
Python
most_actives = [
  ["eq", ["region", "us"]],
  ["btwn", ["intradaymarketcap", 2e9, 1e11]],
  ["gt", ["dayvolume", 5e6]]
]
query = yfs.create_query(most_actives)
The yfscreen::create_payload function in R and yfs.create_payload function in Python create a payload with the search criteria formatted for the Yahoo Finance API.
Parameters
Value
A list representing the payload with the search criteria formatted for the Yahoo Finance API.
Examples
R
payload <- yfscreen::create_payload("equity", query)Python
payload = yfs.create_payload("equity", query)The yfscreen::get_data function in R and yfs.get_data function in Python get data from the Yahoo Finance API using the specified payload.
Parameters
Value
A data frame that contains data from the Yahoo Finance API for the specified search criteria.
Examples
R
data <- yfscreen::get_data(payload)
Python
data = yfs.get_data(payload)
View data
R
head(data[ , c("symbol", "regularMarketPrice.raw",
               "regularMarketChangePercent.raw", ...)])
Python
data[["symbol", "regularMarketPrice.raw",
"regularMarketChangePercent.raw", ...]].head()| symbol | price | chg (%) | vol (m) | mkt cap (b) | ⋯ |
| AAPL | 208.27 | 1.79 | 28.10 | 3,128.65 | ⋯ |
| MSFT | 388.00 | 3.64 | 13.01 | 2,884.38 | ⋯ |
| NVDA | 106.26 | 3.46 | 177.99 | 2,592.74 | ⋯ |
| GOOG | 161.22 | 2.22 | 17.21 | 1,949.05 | ⋯ |
| AMZN | 186.41 | 3.22 | 31.64 | 1,978.26 | ⋯ |
Each screen defines the security type and filters, then follows the same workflow to create the query, create the payload, and get the data:
sec_type <- "mutualfund"
top_mutual_funds <- list(
  list("gt", list("intradayprice", 15)),
  list("eq", list("performanceratingoverall", 4)),
  list("eq", list("performanceratingoverall", 5))
)sec_type <- "etf"
low_cost_etfs <- list(
list("lt", list("annualreportnetexpenseratio", 0.25)),
list("gt", list("fundnetassets", 1e3)),
list("eq", list("performanceratingoverall", 4)),
list("eq", list("performanceratingoverall", 5))
)Each screen defines the security type and filters, then follows the same workflow to create the query, create the payload, and get the data:
sec_type = "future"
active_futures = [
  ["eq", ["region", "us"]],
  ["gt", ["dayvolume", 1e4]],
  ["gt", ["open_interest", 1e4]]
]
sec_type = "index"
advancing_indices = [
  ["eq", ["region", "us"]],
  ["gt", ["percentchange", 0]]
]
Next we use the yfscreen package to analyze how estimated positioning relates to recent performance among “Tactical Allocation” mutual funds, with the categoryname field defining the peer group. The categoryname field reflects the category assigned by the data provider: the screen returns the members of the category at the time the screen is run. The analysis includes 86 funds as of April 1, 2025, with the return history the estimation requires. The sample therefore reflects survivorship bias: the screen includes only the current members of the category, so funds that closed, merged, or left the category over the estimation period are absent. The bias in the results below is limited to attrition during the five-month results window. A screen of current members cannot measure that attrition.
To estimate asset allocations, we use a constrained least squares regression with two explanatory variables: the S&P 500 index (SP500) to represent market exposure and the 3-month Treasury bill rate (DTB3) to represent cash. The objective is to estimate how each mutual fund allocates between market and cash exposures subject to the following constraints:

The sum-to-one constraint ensures that the entire portfolio is allocated between market and cash positions without leverage. The bounds reflect the typical long-only structure of mutual funds.
Exposures are estimated for each fund on each business day from April 2015 through April 2025 using daily returns over a trailing 60-day (three-month) window, with performance measured over the same window. The analysis includes funds once they have sufficient history for the estimation. The results below focus on the window since the U.S. election in November 2024.
We also extend the analysis to an attribution of the difference in performance between quartiles. That is, the actual difference in median performance between the top (Q1) and bottom (Q4) performance quartiles is compared with the difference implied by the median market exposures multiplied by the excess market return over the same trailing window:

R
actual <- median(performance[q1]) - median(performance[q4])
implied <- (median(beta[q1]) - median(beta[q4])) * (market - cash)
Python
actual = performance[q1].median() - performance[q4].median()
implied = (beta[q1].median() - beta[q4].median()) * (market - cash)
The market and cash exposures sum to one by construction, so the implied difference isolates the contribution of the estimated market versus cash split to the actual difference in median performance. Note that the actual difference is positive by construction because the quartiles are sorted on performance at each date. The residual between the actual and implied differences therefore reflects dispersion within quartiles rather than the estimated exposures. The exposures are estimated over the same trailing window used to measure performance, so the attribution is a decomposition rather than a test. That is, sorting on performance also sorts on the product of the exposures and the excess market return. The implied difference is therefore positive as well, apart from days when the trailing market return is near the cash return.
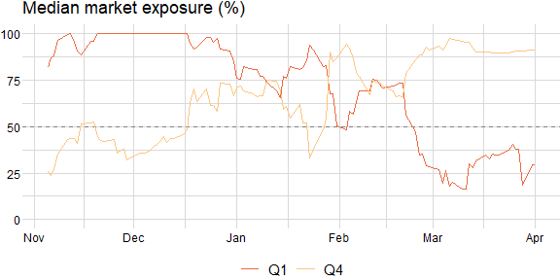
After the estimation of market and cash exposures, we separate mutual funds into performance quartiles and compare positioning over time. The chart below shows the regression-based median market exposure for the top (Q1) and bottom (Q4) performing “Tactical Allocation” funds since the U.S. election in November 2024. The analysis provides insight into how differences in the estimated market versus cash split between quartiles correspond to differences in recent mutual fund performance.
Data source: Federal Reserve Economic Data (FRED): https://fred.stlouisfed.org/; Yahoo Finance API: https://finance.yahoo.com/
The estimated market exposure for the top quartile falls at the end of February (i.e., the estimated cash allocation rises), ahead of the market volatility that followed. The quartiles also switch over the results window: the top quartile holds the higher market exposure through December, when the trailing market return exceeds the cash return. The excess market return turns negative after February 20, 2025, which is also the last date the top quartile holds the higher market exposure. The exposure gap between quartiles therefore changes sign with the excess market return, as the shared trailing window implies. The bottom quartile holds the higher market exposure afterward, with the gap reaching roughly 80 percentage points on March 10, 2025. The excess market return is roughly -9% at that date, down from a high of roughly 11% on November 29, 2024. The performance difference between quartiles therefore corresponds to the difference in the estimated market versus cash split rather than to security selection within the funds.
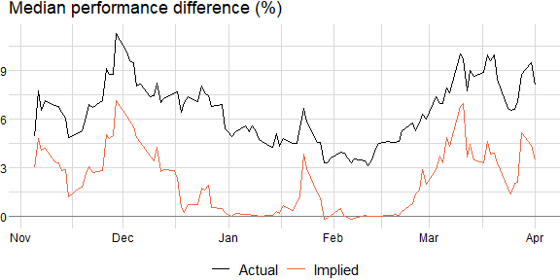
The chart below extends the comparison to the difference in median performance between quartiles, together with the difference implied by the estimated exposures.
Data source: Federal Reserve Economic Data (FRED): https://fred.stlouisfed.org/; Yahoo Finance API: https://finance.yahoo.com/
The implied difference tracks the actual difference over the results window: the correlation between the two series is 0.87, although the shared trailing window raises the correlation by construction. Both series peak on November 29, 2024, when the implied difference of roughly 7 percentage points accounts for about two-thirds of the actual difference of roughly 11 percentage points. The residual between the two series is roughly constant, averaging 4 percentage points with a standard deviation of 1 percentage point, across months of different market conditions. Dispersion within quartiles keeps the residual positive even when the trailing market return is near the cash return, though the stability of the residual is an empirical result rather than a mechanical one. That is, the decomposition attributes the variation over time in the performance difference between quartiles to the estimated market versus cash split, and the roughly constant level of the residual to dispersion within quartiles.
The yfscreen package provides simple and efficient access to Yahoo Finance’s screener API for querying and retrieving financial data. It abstracts the complexities of session management, crumb and cookie handling, query construction, pagination, and JSON payload generation. This allows users to focus on filtering and retrieving data across a range of security types, including equities, mutual funds, ETFs, indices, and futures. The package supports advanced query capabilities, such as logical operators, nested filters, and customizable payloads, and automatically handles pagination to retrieve large datasets efficiently. It is available for both R and Python to make it accessible for a broad audience. The analysis of tactical allocation mutual funds illustrates how the package can be used to estimate asset exposures and interpret positioning differences across funds, including a decomposition of the performance difference between quartiles into the estimated market versus cash split and dispersion within quartiles. The workflow is available in both languages: for more on constrained least squares, go to https://jasonjfoster.github.io/posts/optim-r/ for R code and https://jasonjfoster.github.io/posts/optim-py/ for Python code.
Information posted on IBKR Campus that is provided by third-parties does NOT constitute a recommendation that you should contract for the services of that third party. Third-party participants who contribute to IBKR Campus are independent of Interactive Brokers and Interactive Brokers does not make any representations or warranties concerning the services offered, their past or future performance, or the accuracy of the information provided by the third party. Past performance is no guarantee of future results.
This material is from Jason Foster and is being posted with its permission. The views expressed in this material are solely those of the author and/or Jason Foster and Interactive Brokers is not endorsing or recommending any investment or trading discussed in the material. This material is not and should not be construed as an offer to buy or sell any security. It should not be construed as research or investment advice or a recommendation to buy, sell or hold any security or commodity. This material does not and is not intended to take into account the particular financial conditions, investment objectives or requirements of individual customers. Before acting on this material, you should consider whether it is suitable for your particular circumstances and, as necessary, seek professional advice.
Mutual Funds are investments that pool the funds of investors to purchase a range of securities to meet specified objectives, such as growth, income or both. Investors are reminded to consider the various objectives, fees, and other risks associated with investing in Mutual Funds. Please read the prospectus accordingly. This communication is not to be construed as a recommendation, solicitation or promotion of any specific fund, or family of funds. Interactive Brokers may receive compensation from fund companies in connection with purchases and holdings of mutual fund shares. Such compensation is paid out of the funds' assets. However, IBKR does not solicit you to invest in specific funds and does not recommend specific funds or any other products to you. For additional information please visit https://www.interactivebrokers.com/en/index.php?f=1563&p=mf
Any discussion or mention of an ETF is not to be construed as recommendation, promotion or solicitation. All investors should review and consider associated investment risks, charges and expenses of the investment company or fund prior to investing. Before acting on this material, you should consider whether it is suitable for your particular circumstances and, as necessary, seek professional advice.
Futures are not suitable for all investors. The amount you may lose may be greater than your initial investment. Before trading futures, please read the CFTC Risk Disclosure. A copy and additional information are available at ibkr.com.
Please keep in mind that the examples discussed in this material are purely for technical demonstration purposes, and do not constitute trading advice. Also, it is important to remember that placing trades in a paper account is recommended before any live trading.
The third-party code discussed within this article is not investment or trading advice, and is for proof-of-concept, educational, and illustrative purposes only. IBKR makes no representations or warranty regarding its accuracy or completeness. Users are solely responsible for conducting their own independent testing and due diligence before applying any code or concepts in a live or production environment











Join The Conversation
For specific platform feedback and suggestions, please submit it directly to our team using these instructions.
If you have an account-specific question or concern, please reach out to Client Services.
We encourage you to look through our FAQs before posting. Your question may already be covered!