
- Solve real problems with our hands-on interface
- Progress from basic puts and calls to advanced strategies
Interactive Options Course

Posted November 10, 2025 at 11:15 am
It is common to hear that we live in an era of a war on science, with intentional campaigns and societal forces unjustly undermining expert authority on scientific knowledge. At the same time, numerous examples exist of scientific and science-adjacent experts demonstrating a lack of trustworthiness and reliability. These include the “replication crisis” in psychology (where only 36% of published results could be replicated), high-profile reversals of government dietary advice on topics such as recommended fat intake, and COVID-era reversals of mask-wearing guidelines.
But what criteria determine whether some knowledge claims are legitimately disputable and others are not? Can we simply rely on our intuitions about how much we favor the claims or their consequences? Clearly, that would contradict the principles of the scientific method and would leave society collectively adrift without a shared understanding of reality.
Luckily, Daniel Sarewitz and Steve Rayner, two scholars of the relationship between science and society, have discussed several dimensions that help to identify the trustworthiness of claims to expertise and knowledge. Two aspects I find particularly useful are 1) how feedback-rich and falsifiable the knowledge is, and 2) how high the stakes are in terms of broader value-laden ramifications.
First, trustworthiness and reliability increase when knowledge producers or experts receive rapid, repeated, real-world feedback and clear performance metrics. Sarewitz and Rayner give examples of pilots and surgeons as “practitioner” experts who occupy this space: their reliability and credibility are derived directly from the large number of feedback-rich trials on which they have built their expertise. Sarewitz and Rayner contrast this with “inappropriate expertise,” where supposed experts may be credentialed, but they seek to advise on matters in which they have not been practically able to accrue a demonstrably reliable track record. An example may be a group of international relations PhDs advising the government on whether to go to war.
Second, trustworthiness and reliability decrease when stakes are high and values are contested because, in those cases, knowledge generation is highly susceptible to cultural forces and thus motivated cognition. The broader incentive structure and/or often unconscious preferences lead knowledge producers (researchers, scientific institutions, universities, etc.) to begin with a strongly preferred broader conclusion and then gather evidence to support it.
When assessing the general trustworthiness of scientific or science-adjacent claims to knowledge, I have found it useful to arrange these two ideas (slightly reframed and rephrased) in a two-dimensional space:
Below, I put “How testable is the relevant real-world conclusion?” on the horizontal axis.
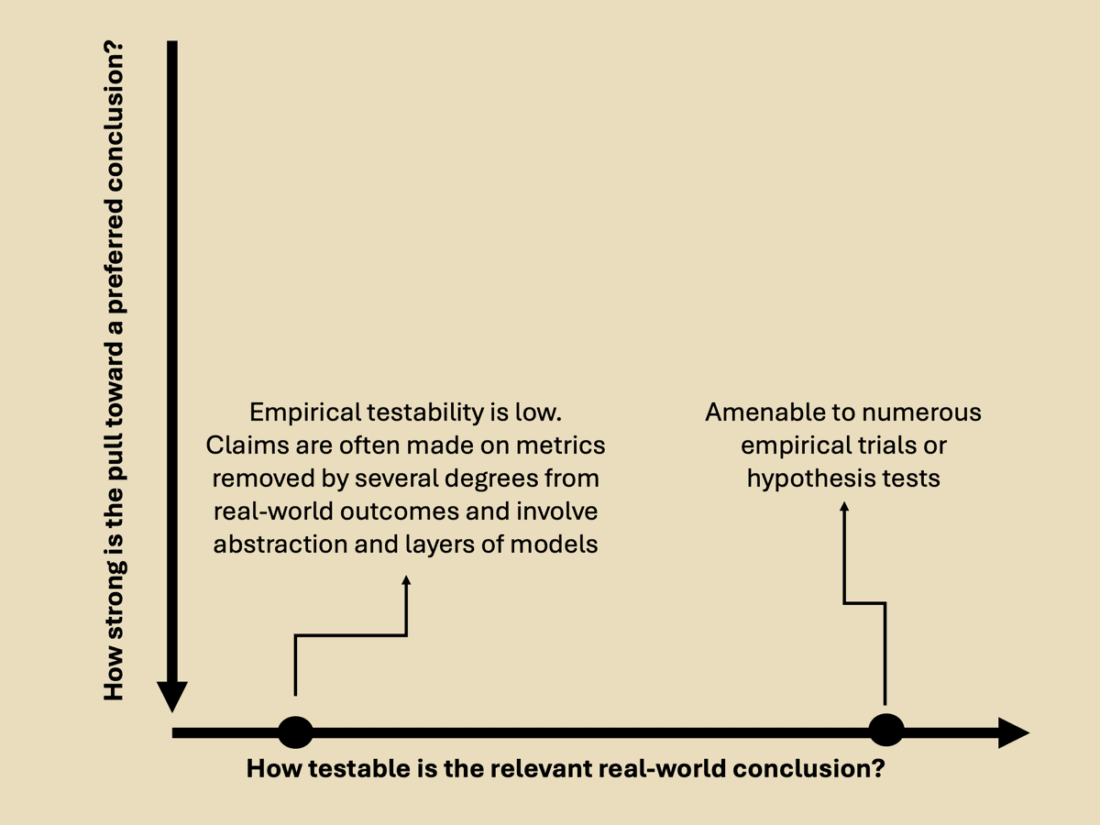
Diagram made in Microsoft PowerPoint.
I put “How strong is the pull toward a preferred conclusion?” on the vertical axis.

Diagram made in Microsoft PowerPoint.
With these two dimensions, we can broadly characterize scientific claims to knowledge into four quadrants (I, II, III, IV).
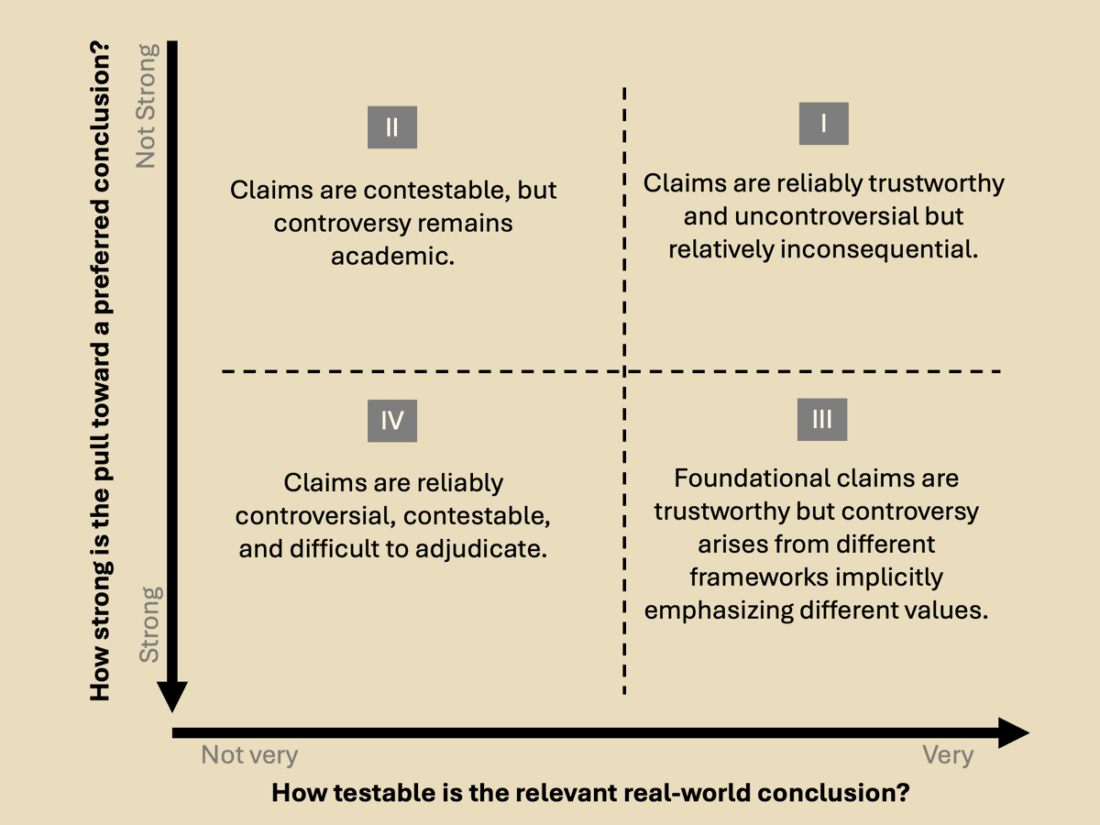
Diagram made in Microsoft PowerPoint.
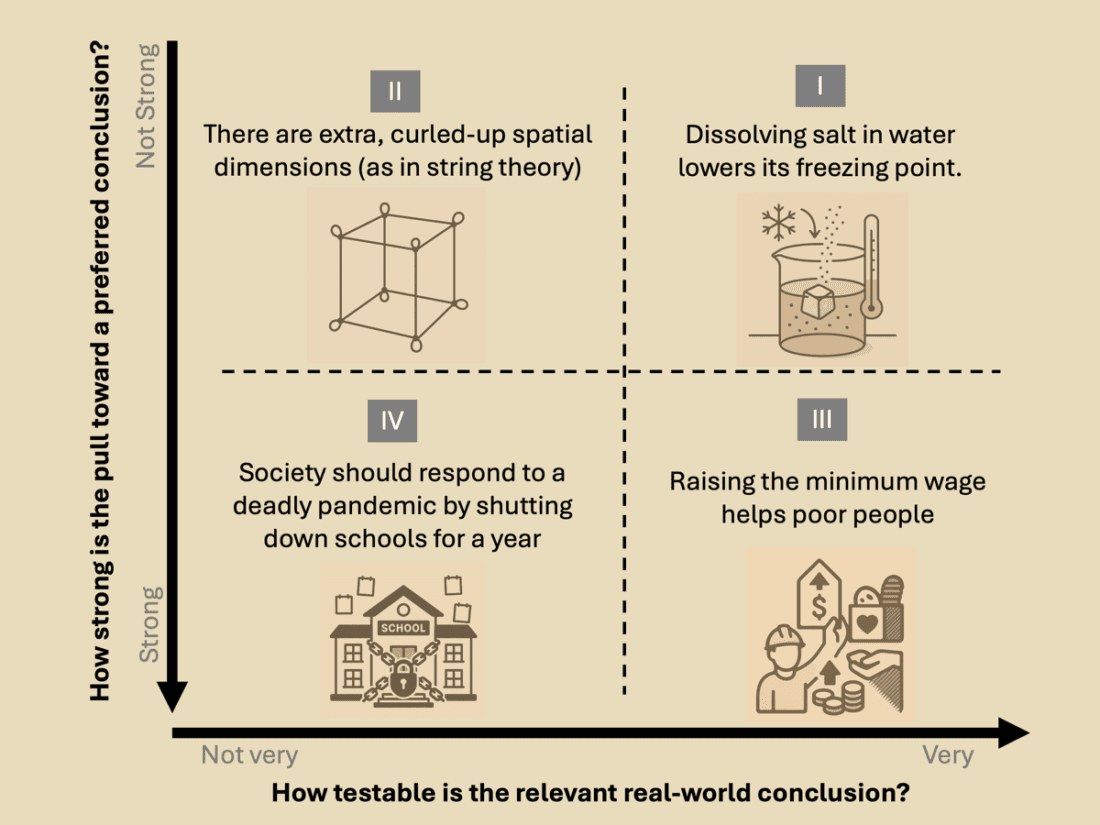
Diagram made in Microsoft PowerPoint. Icons made by ChatGPT.
Quadrant I: Claims are reliably trustworthy and uncontroversial but relatively inconsequential.
Quadrant I is the purest realm of the scientific method, where knowledge producers are motivated solely by the pursuit of truth. They engage in an iterative cycle of posing testable hypotheses, deriving predictions, confronting these with reproducible observations/experiments, analyzing the results, and revising or discarding the hypotheses accordingly.
Examples in Quadrant I include the science facts that students learn and practice demonstrating in grade school, such as how dissolving salt in water lowers the freezing point of the water. Such a claim can be demonstrated quickly and easily anywhere, and it has no broader social ramifications or bearing on one’s career, identity, or beliefs.
Quadrant II: Claims are contestable, but controversy remains academic.
In Quadrant II, broader conclusions are not subject to definitive tests either in principle or due to practical limits related to, for example, spatial scale or timescale. Thus, trustworthiness remains provisional and is based on evaluating the internal consistency of claims, indirect evidence, or mathematical elegance.
At the same time, there’s little incentive for the knowledge producers to desire specific conclusions since the broader moral or sociopolitical implications are small.
An example in Quadrant II might be the hypothesized extra, compactified spatial dimensions of string theory. It’s a well-structured idea supported by formalism, but direct, definitive testing is challenging, leading the arguments to focus mainly on theoretical plausibility.
Quadrant III: Foundational claims are trustworthy, but controversy arises from different frameworks implicitly emphasizing different values.
In Quadrant III, core foundational claims and, to a lesser extent, broader conclusions are testable. However, controversy arises due to disagreements on which evidence deserves the most weight and which conclusions to emphasize.
When you are near the bottom of the vertical axis, there is a great deal of susceptibility to motivated cognition. Human beings generate scientific knowledge, and human beings are far from being purely rational robots. Thus, scientific knowledge is influenced by ethical intuitions, culture, and peer pressure among researchers, as well as the incentive structures of research funding and publishing systems (see the Bias and Science section of Clark et al. 2023).
This means that there will often be pulls towards certain themes and broader conclusions over others, independent of the evidence. Since constructing research papers involves numerous researcher degrees of freedom (such as the research question to ask, the methodological specifics for addressing the question, and the focus of the paper’s abstract and title), there is significant latitude for selection biases to favor preferred broader conclusions over nonpreferred ones.
An example from Quadrant III might be the claim that raising the minimum wage helps poor people. That claim may seem straightforward enough to be tractable, but a problem is that “helps” is a value-laden verb and is interpretable in many different ways. Empirical evidence might show that raising the minimum wage increases wages for those low-paid workers who are actually employed, but has conflicting effects on broader hours worked, employment levels, or small-business survival. One might argue (with data and models) that a minimum wage narrowly raises incomes in lower terciles in the short term but stifles economic growth in the long term, eventually harming society overall, including poor people. Whether this policy “helps” depends on which outcomes are prioritized, the specific populations considered, and the time frame of concern. These debates may seem to focus only on the technical aspects of the question, but they also incorporate ethical and value disputes that are inherently political. These political disputes are not so much about fundamental facts but rather are about “who gets what, when, and how” [Lasswell (1958) via Pielke Jr. (2004)].
Quadrant IV: From the perspective of desiring neat, straightforward answers, Quadrant IV is a mess.
Claims are reliably controversial, contestable, and difficult to adjudicate because they are framework and model-dependent, difficult to test, embed value-laden assumptions, and are strongly susceptible to personally and culturally-influenced motivated cognition by the experts producing the knowledge. The same suite of evidence or underlying facts can be legitimately assembled into coherent narratives that seem completely at odds with each other, and there is no straightforward way to adjudicate which emphasis is “correct” (See Sarewitz, 2004).
An example could be the claim that society should respond to a deadly pandemic by shutting down schools for a year. The counterfactuals are highly uncertain, objectives are numerous and incommensurate (mortality, learning, equity, livelihoods). Rapid, controlled, clear tests don’t exist, and many interests influence the desirability of different conclusions.
As a climate scientist by training, I pay close attention to climate science, and I have noticed that much of the field’s most prominent research and messaging tends to be highly susceptible to preferred conclusions and has low testability. Often, this is because the claims are inherently political, making them relatively easy to identify as native to Quadrant IV.
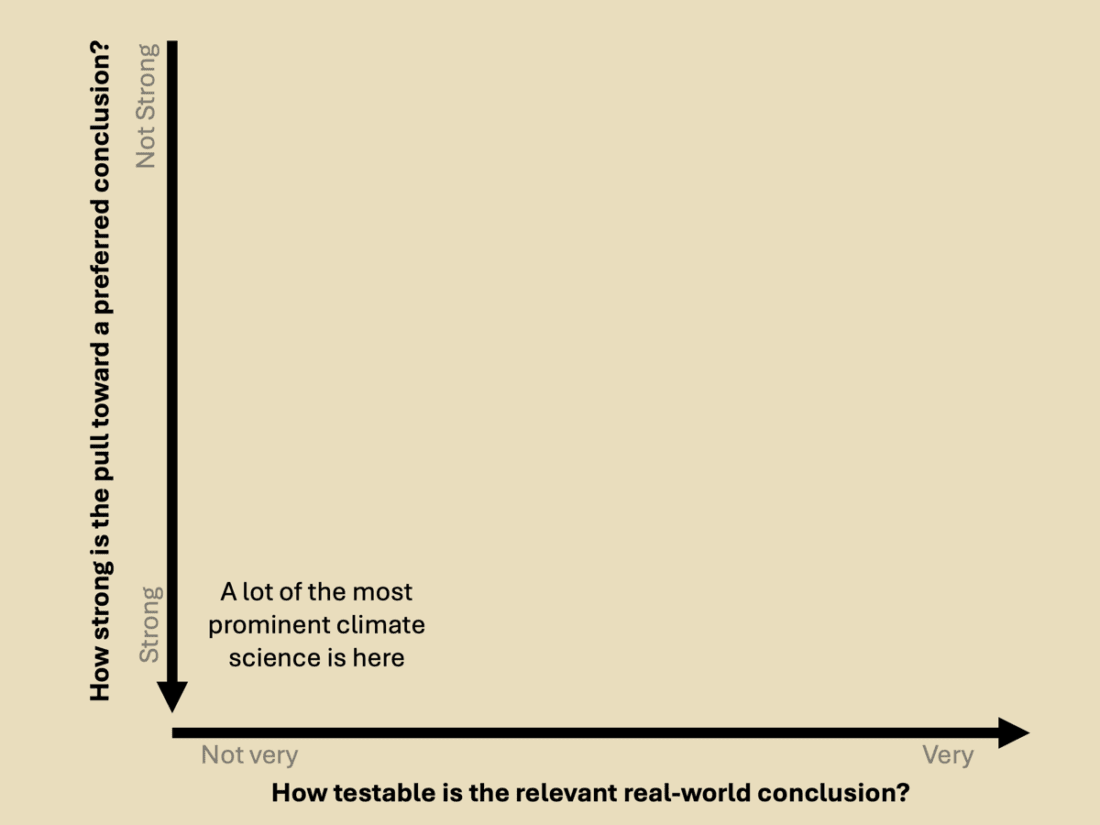
Diagram made in Microsoft PowerPoint.
However, there are also many instances of Quadrant IV climate science claims that focus on physical and biological systems, making them difficult to properly identify as Quadrant IV claims that are legitimately contestable.
I will illustrate this with two examples from the past year.
Example 1: Are all hurricanes now an entire category stronger?
I have previously written about a paper titled “Human-caused warming has intensified recent hurricanes,” which made the very bold claim that essentially all Atlantic hurricanes are one category stronger than they would have been under preindustrial conditions and accordingly received considerable attention. Hurricane categories are defined by wind speed, so a basic sanity test of this claim (or at least the spirit of this claim) would be to look at long-term historical trends in convectional measures of tropical cyclone wind speed like Accumulated Cyclone Energy (ACE). When you do this, you find no global trend over the past 40 years (when we have good data), despite substantial warming over that period. Essentially, to get their dramatic result, they focused primarily on the influence of a causal variable known to make tropical cyclones stronger (warming sea surface temperatures) and downplayed causal variables known to make the environment more hostile to tropical cyclone formation and maintenance. The core idea that hurricane activity is much worse now due to warming could have been tested against empirical observations (and it would not have passed that test), but the research methodology was so specific and contained so many conditions that testing the narrow claim of the paper amounts to just reproducing their analysis rather than testing their claim for reproducibility. Robustness of results does not imply robustness of conclusions, so this places the claim on the left side of the horizontal axis.
So were the methodological choices to emphasize exacerbating causal variables coincidences, or was there a strong pull towards a desired conclusion? The paper itself spells out that the study was at least partially motivated to influence public opinion stating the the idea was to “connect the dots” between climate change and hurricanes because “landfalling hurricanes with high intensities—can act as ‘focusing events’ that draw public attention” and that “Increased attention during and in the wake of storms creates opportunities for public and private discourse around climate and disaster preparedness.”
Also, all three authors are employed by Climate Central, which is explicitly an advocacy organization whose main aim is to promote climate action. Additionally, all three study funders (Bezos Earth Fund, The Schmidt Family Foundation, and the CO₂ Foundation) have mission statements aligned with the paper’s findings. For example, the CO₂ Foundation states that its mission is communication about the urgent societal risks from extreme weather (linked to CO₂-related). After the paper’s publication, Climate Central fundraising emails highlighted that their analysis influenced media coverage of Hurricanes Helene and Milton, encouraging more financial support from subscribers.
All this amounts to substantial evidence of a very strong pull towards a desired conclusion, putting the paper towards the bottom of the vertical axis.
Example 2: Will crop production decrease in the future?
Another recent high-profile example from this year was the study “Impacts of climate change on global agriculture, accounting for adaptation,” published in Nature.
A main claim originating from the paper, promulgated in the media, was that “Children born now may live in a world where the U.S. can only produce half as much of its key food crops.” Indeed, the paper’s language and its projection figure (Fig. 3) suggest substantial declines in agricultural production over the remainder of the century. As in Example 1 above, a basic sanity test for this projection might be to examine historical trends in agricultural productivity as temperatures have risen over the past. That test would show that yields of major crops have dramatically increased over that time period despite warming. So, what explains this discrepancy? The paper’s results are relative to an unspecified counterfactual, and its projections inherently exclude innovation, which amounts to imagining that agricultural research and development (which has historically driven the dramatic increase in crop yields) suddenly stops tomorrow. Therefore, their claims cannot be taken as actual predictions of the future; and therefore they are essentially untestable and unfalsifiable, placing them to the left on the horizontal axis.
Was it an oversight on the authors’ part that they failed to communicate that their results were not absolute predictions of future crop yields? There is strong evidence that it was not. The paper’s construction and its interactions with the media suggest the authors were comfortable with this ambiguity. Further, authors of the study expressed that they hoped “the study will provide more evidence for the urgent need to transform the energy system and the high cost of failing to do so”. Overall, the prestigious venue where the article was published, the widespread attention and fawning media coverage, and the author’s expressed activism indicate a strong pull towards a preferred conclusion, placing the claims to the left on the horizontal axis.
Claims being native to Quadrant IV wouldn’t be such a serious problem if these claims represented an unbiased sample of all the claims that could legitimately be made. In other words, different entities may have different preferred conclusions (often based on different moral frameworks), but if these preferred conclusions were randomly sampled, then assessing them in aggregate would accurately indicate how wide a range of views are legitimate on the matter. A bigger problem arises when those people producing the knowledge (researchers, scientific institutions, universities, etc.) have a tendency to favor certain preferred conclusions over others. Since scientific knowledge is “the intellectual and social consensus of affiliated experts…” (Oreskes, 2004), this gives the illusion of a much narrower picture of reality than is actually epistemically justified.
How prediction markets can help
To increase the reliability and trustworthiness of claims, we’d like to shift the orientation up and to the right. To raise a claim on the vertical axis, you’d want to reduce the pull toward a preferred conclusion (which may be preferred for reasons other than accuracy) and increase the pull toward a conclusion that more purely emphasizes correctness.
On the horizontal axis, you’d like to make sure that the accuracy of the conclusion will actually be evaluated. This shifts the focus away from making somewhat obscure, hard-to-test claims on, e.g., past data and instead emphasizes making real-world predictions about the future.
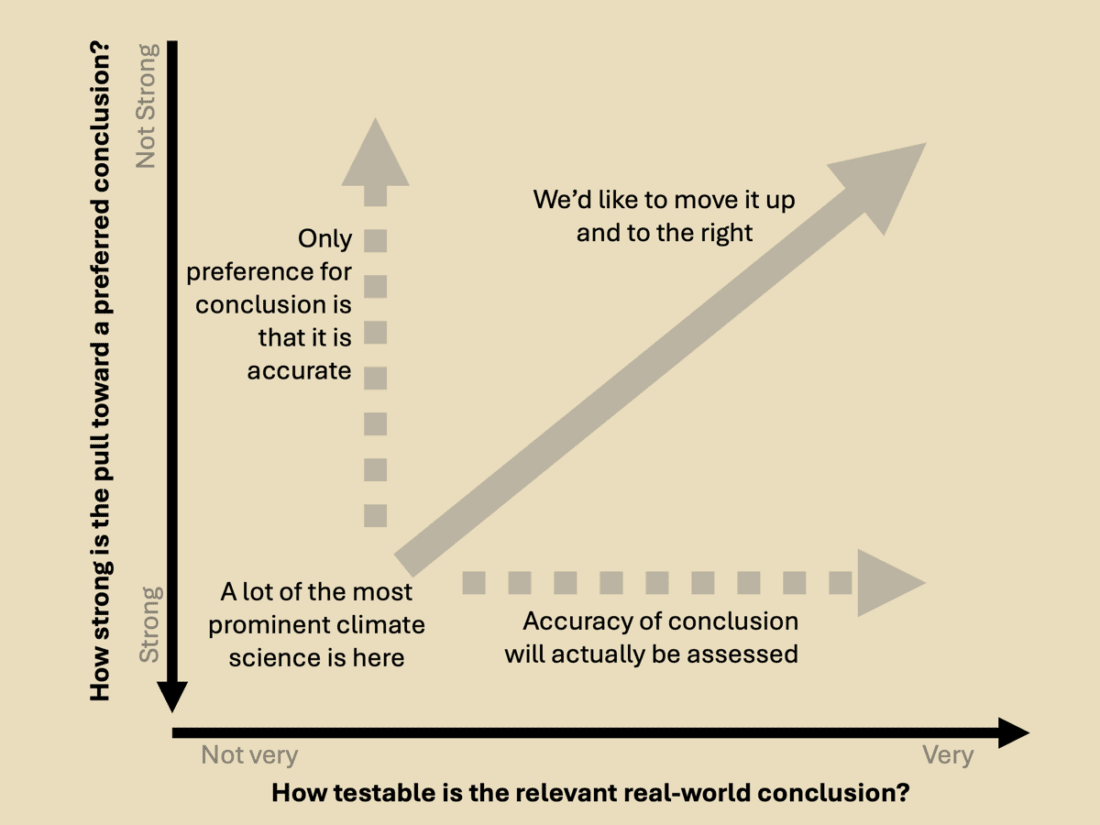
Diagram made in Microsoft PowerPoint.
I am in charge of climate prediction markets at Interactive Brokers, and I see prediction markets as being essentially designed to accomplish both of the above goals.
Prediction markets allow people to take financial positions on the outcomes of future events. Thus, similar to the famous wager between Julian Simon and Paul Ehrlich on resource depletion, they encourage intellectual disputes to shift from vague proclamations to precise, well-defined claims about the future that will be tested. Furthermore, the monetary aspect aligns incentives, as there is no better motivation to put forth your best understanding of reality than to have financial (and, in the case of public wagers, reputational) skin in the game. This also shifts the emphasis away from explaining the past and towards the most powerful (and useful) kind of evidence in science: accurate predictions made about the future.
The negotiation of the terms between even two prominent representatives of different views illuminates a great deal of information. Prediction markets, however, take this same idea and expand it by aggregating and distilling the wisdom of the crowd into a single probability or price. Being naturally probabilistic, they also center inherent uncertainty rather than artificially side-stepping it.
Prediction markets are not a new concept or something emerging from outside academia. Numerous studies have examined their accuracy, and they even have their own dedicated academic journal. This body of research demonstrates that prediction markets have consistently performed as well as or significantly better than alternatives. Pilot programs in climate prediction markets have shown promise, demonstrating accurate predictions on variables as diverse as UK monthly rainfall, average daily maximum temperature, annual wheat yields, monthly El Niño indices, annual Atlantic hurricanes, and annual US hurricane landfalls.
So what would an embrace of prediction markets mean in practice? Academic researchers in climate could further study the accuracy and reliability of prediction markets, or they could formulate research questions and models specifically to inform predictions in these markets.
Returning to the two examples above, this would reorient research questions from forms that are not particularly useful, like
Historically, how have warm sea-surface temperatures influenced hurricane strength, while keeping the number of hurricanes constant and largely ignoring factors that could make the environment more hostile to hurricanes?
To,
How many major hurricanes will there be in the Atlantic Basin in 2026, 2030, or 2035?
Or from,
How will climate change affect crop yields relative to an unspecified counterfactual, using a narrow definition of adaptation, ignoring further innovation, and assuming an implausible emissions scenario that combines the least economic growth with the highest emissions?
To,
What will global crop yields be in 2026, 2030, or 2035?
These research questions are simpler, clearer, and more practical for decision-makers and society. They shift incentives away from signaling ‘good team’ membership to focus on accuracy above all else.
The markets also help address trust problems by selecting the most accurate forecasters through empirical trial and error (continuous losses in these markets strongly incentivize improvement or exiting the market), rather than relying on heuristics like credentials. This openness and lack of gatekeeping should be particularly attractive to the segment of society inherently skeptical of the expert class.
Referring back to Sarewitz and Rayner’s discussion on evaluating expertise, this approach turns “inappropriate” experts into “practitioner” experts whose reliability comes not from claims to expertise and authority but from feedback-rich trials.
New to Prediction Markets?
Open a Prediction Markets AccountThe analysis in this material is provided for information only and is not and should not be construed as an offer to sell or the solicitation of an offer to buy any security. To the extent that this material discusses general market activity, industry or sector trends or other broad-based economic or political conditions, it should not be construed as research or investment advice. To the extent that it includes references to specific securities, commodities, currencies, or other instruments, those references do not constitute a recommendation by IBKR to buy, sell or hold such investments. This material does not and is not intended to take into account the particular financial conditions, investment objectives or requirements of individual customers. Before acting on this material, you should consider whether it is suitable for your particular circumstances and, as necessary, seek professional advice.
The views and opinions expressed herein are those of the author and do not necessarily reflect the views of Interactive Brokers, its affiliates, or its employees.
Interactive Brokers LLC is a CFTC-registered Futures Commission Merchant and a clearing member and affiliate of ForecastEx LLC (“ForecastEx”). ForecastEx is a CFTC-registered Designated Contract Market and Derivatives Clearing Organization. Interactive Brokers LLC provides access to ForecastEx Forecast Contracts for eligible customers. Interactive Brokers LLC does not make recommendations with respect to any products available on its platform, including those offered by ForecastEx.
For specific platform feedback and suggestions, please submit it directly to our team using these instructions.
If you have an account-specific question or concern, please reach out to Client Services.
We encourage you to look through our FAQs before posting. Your question may already be covered!
Related Articles


")


nice article imho, though the only relevant axis is the horizontal one. the vertical axis regarding strength of pull to a preferred conclusion is irrelevant as far as the accuracy goes though it may well influence the methodology. your argumentation is good even though it seems to be drawn somewhat towards the bottom of the vertical axis.
Good article. I worked on climate issues (ozone depletion) for several years and even got some awards for the commercial results of that work. I watched the climate researcher community, in large measure, switch from their earlier emphasis on “global warming” to “climate change.” I think that was because the latter is more nebulous and more difficult to test and hence refute or confirm. Most of these folks depend on continued uncertainty or alarm for research funding. That’s not a good way to get reliable answers. Again, good article. Thanks for writing it.
A great example of a Quadrant IV conclusion is when certain politicians insisted the wild fires in Pacific Palisades and Santa Monica CA was a result of climate change. It’s noteworthy the politicians fell back to “Global Warming’ rather than “Climate Change” to support their erroneous claim. I don’t think I need to name the political party making this claim. We all know it was typical gaslighting.
Really enjoyed reading about When are scientific claims and expert assertions untrustworthy? And how prediction markets can help. | IBKR Campus US. The depth of analysis here is impressive and gives readers a lot to think about. seedance 2.0 ai video generator