
- Solve real problems with our hands-on interface
- Progress from basic puts and calls to advanced strategies
Interactive Options Course

Posted August 4, 2026 at 12:00 pm
Imagine having a completely legal, highly transparent window into the exact portfolios of the most influential financial players on the globe. While many beginners operate under the illusion that global finance is a shadowy, manipulated arena where retail traders are kept in the dark, the reality is entirely different. Everything is perfectly transparent if you know where to look. You can actually see who is buying, who is selling, and where the next massive price movement is likely to originate.
The key to this invaluable information is the COT report (Commitments of Traders), a weekly document released by the Commodity Futures Trading Commission (CFTC). It is designed to help the public understand market dynamics by breaking down the positions of the biggest institutional players. By the end of this guide, you will know exactly how to interpret this data and integrate it into a highly practical, profitable investing strategy.
Every week, the CFTC publishes the COT report on its official website. If you scroll through it, you will find data for every single listed future on the market: currencies like the Canadian Dollar or British Pound, agriculture, metals, stock indexes, petroleum, treasuries, and natural gas. It categorizes the market participants into groups such as dealer intermediaries, institutional asset managers, and leveraged funds, showing their long, short, and net positions.
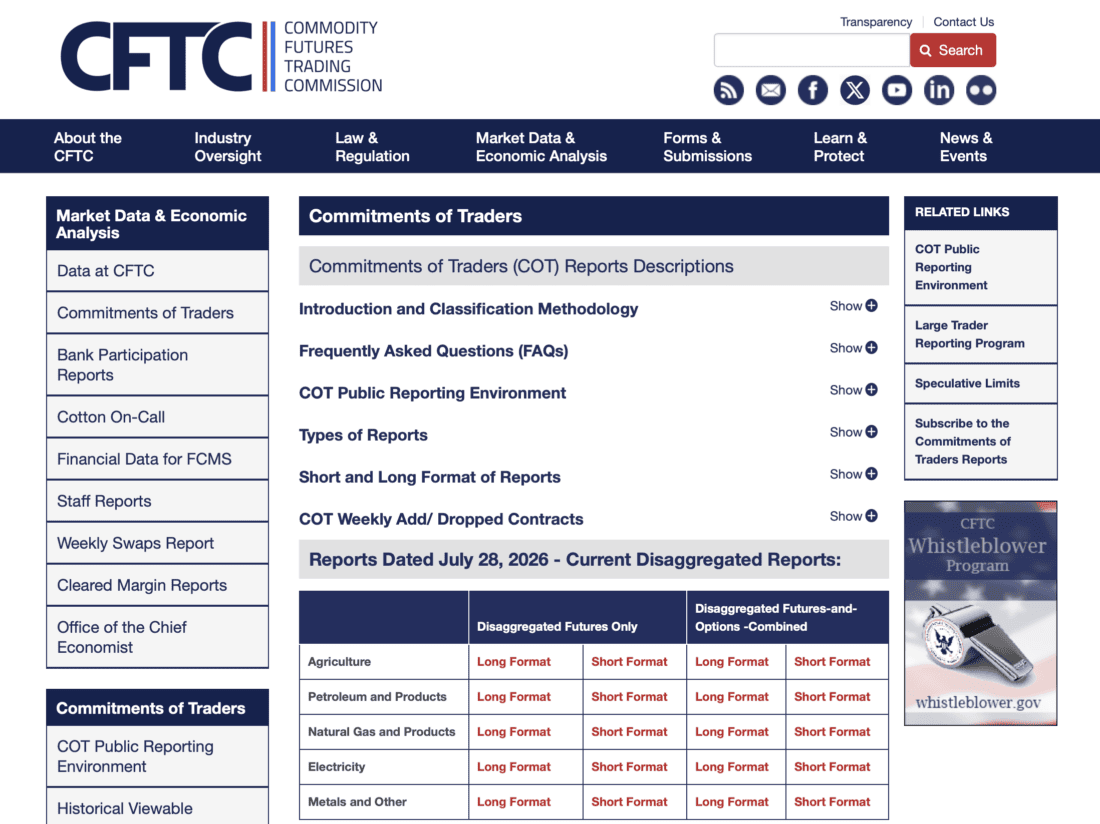
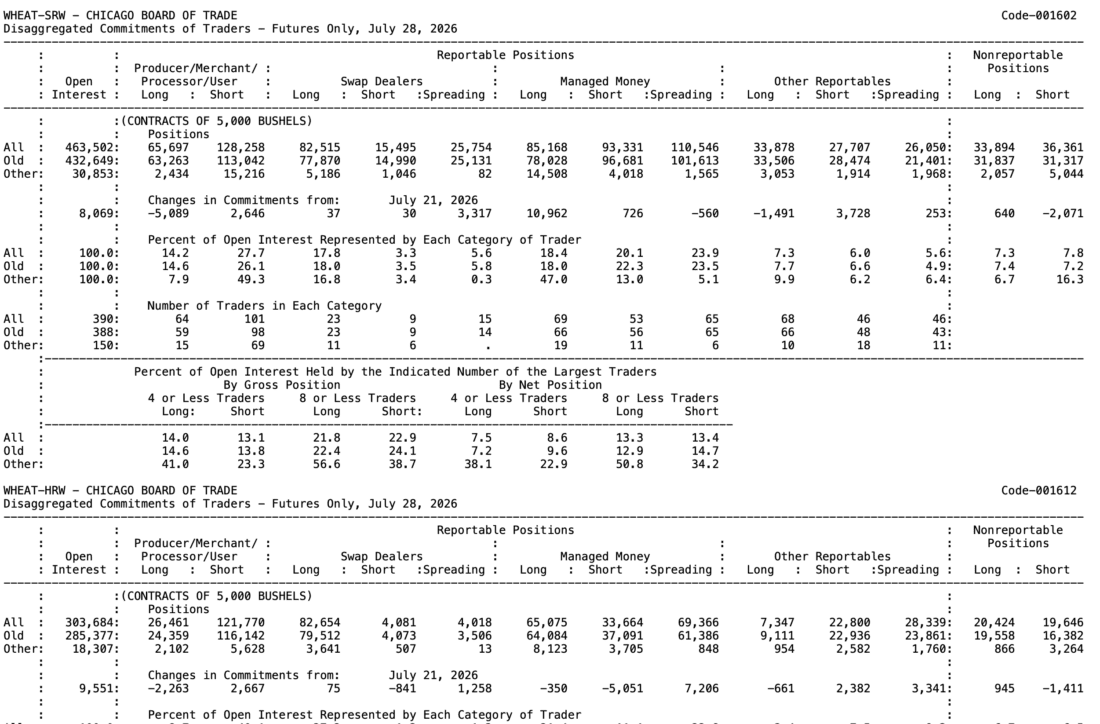
However, there is a massive catch. The original version provided by the commission is incredibly old-school. It is a dense, text-heavy wall of numbers that is incredibly difficult and time-consuming to read.
This is exactly why we rely on Forecaster, our proprietary software for 360-degree financial analysis. Forecaster is the absolute foundation of our strategy, integrating everything from seasonality and technical indicators to fundamental analysis, corporate balance sheets, and advanced AI models. What Forecaster does with the COT report is beautifully simple: it collects all this complex weekly data and plots it directly onto clean, interactive charts.
Instead of reading raw text, you can open the Forecaster terminal and immediately see a line chart or a bar chart representing the net positions of asset managers right below the price chart of the S&P 500. You can merge the charts, separate them, and look back through the entire historical data to instantly grasp the big picture. We don’t use this to predict the future with a crystal ball; we use it to understand how prices are reacting to the actual volume of money moving behind the scenes.
When analysts and traders first discover the COT report, they almost universally make the exact same mistake. They focus entirely on the non-commercial positions, which consist of professional money managers, Commodity Trading Advisors (CTAs), and hedge funds.
The flawed logic goes like this: these guys manage billions of dollars, therefore they must always be right, and they must know the future of a specific financial instrument. This is completely false. Professional managers cannot predict the future any better than we can, and they make mistakes all the time.
Furthermore, these massive funds have a structural problem that retail investors do not have: liquidity. If we want to go long on the S&P 500, we click a button on our trading platform, and the trade is executed instantly. Hedge funds cannot do that. Because they have billions to allocate, they have to move very slowly. Building a long or short position takes them weeks or months.
Therefore, our goal is not to blindly copy what the big players are doing. Our goal is to analyze how the market is moving compared to the volume they are slowly injecting into the system. Another critical error is looking at only one category. To get a true read on an asset like the S&P 500, you must analyze multiple categories. You need to look at the speculative non-commercials alongside the asset managers, who invest for the long run and provide crucial insights into the fundamental valuation of the market. By comparing these categories—and using tools like our Gap Index to spot extreme divergences between them—we can identify highly probable market tops and bottoms.
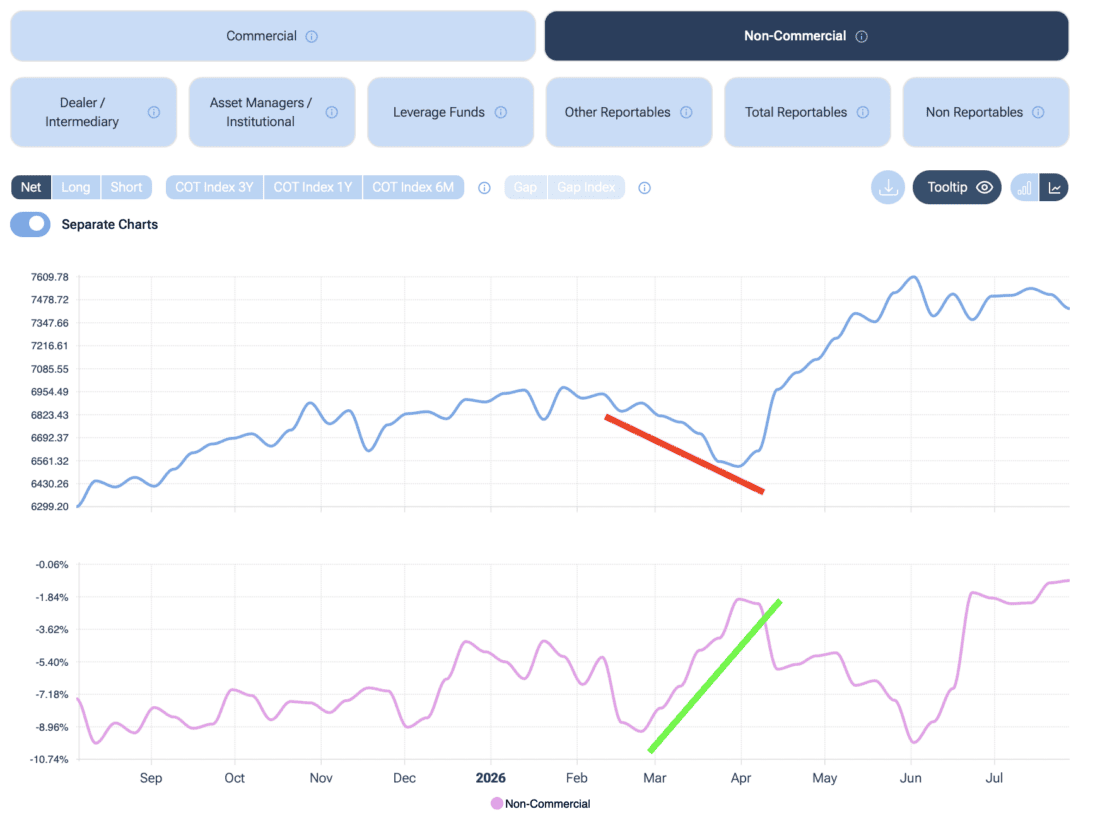
The single most important concept to grasp when analyzing the COT report is the divergence. You must actively search for divergences between the price of an asset and the net positions (longs minus shorts) of a specific category of investors.
A divergence occurs when the price is moving in one direction, but the net positions are moving in the exact opposite direction. When this happens, it is a glaring signal that a major top or bottom is forming.
Let’s look at the S&P 500 as a prime example. During a recent major market bottom, the price of the S&P 500 was in a clear downtrend, tumbling lower and lower. However, if you looked at the net positions of the non-commercials in the Forecaster terminal during that exact same period, they were rising sharply. While the market was bleeding, speculative traders were heavily adding long positions. They knew the bear market was merely a correction and were buying aggressively. Price going down, net positions going up: that is a massive divergence and a true sign that a reversal is imminent.
We saw similar patterns looking back at the beginning of 2026, and also during the bull run of 2024 into early 2025. In late 2024, the S&P 500 was pushing higher, making new all-time highs. But if you looked at the asset managers, starting from September 2024, they were actively decreasing their long positions. They recognized the market was fundamentally overpriced. They sold heavily into the rally. When the price finally dropped, forming a new low in the spring of 2025, these same asset managers started aggressively buying again.

When you see both non-commercials and asset managers buying heavily at a market low, you have confirmation from multiple angles that the asset is undervalued. Conversely, if the net position line is moving in the exact same direction as the price, it simply confirms that the current trend is healthy, safe, and sound.
As we established, analyzing just one category limits your perspective. The true magic happens when you compare opposing categories, specifically the commercials and the non-commercials. When you plot them together on the same chart, you will immediately notice that they behave in completely different ways.
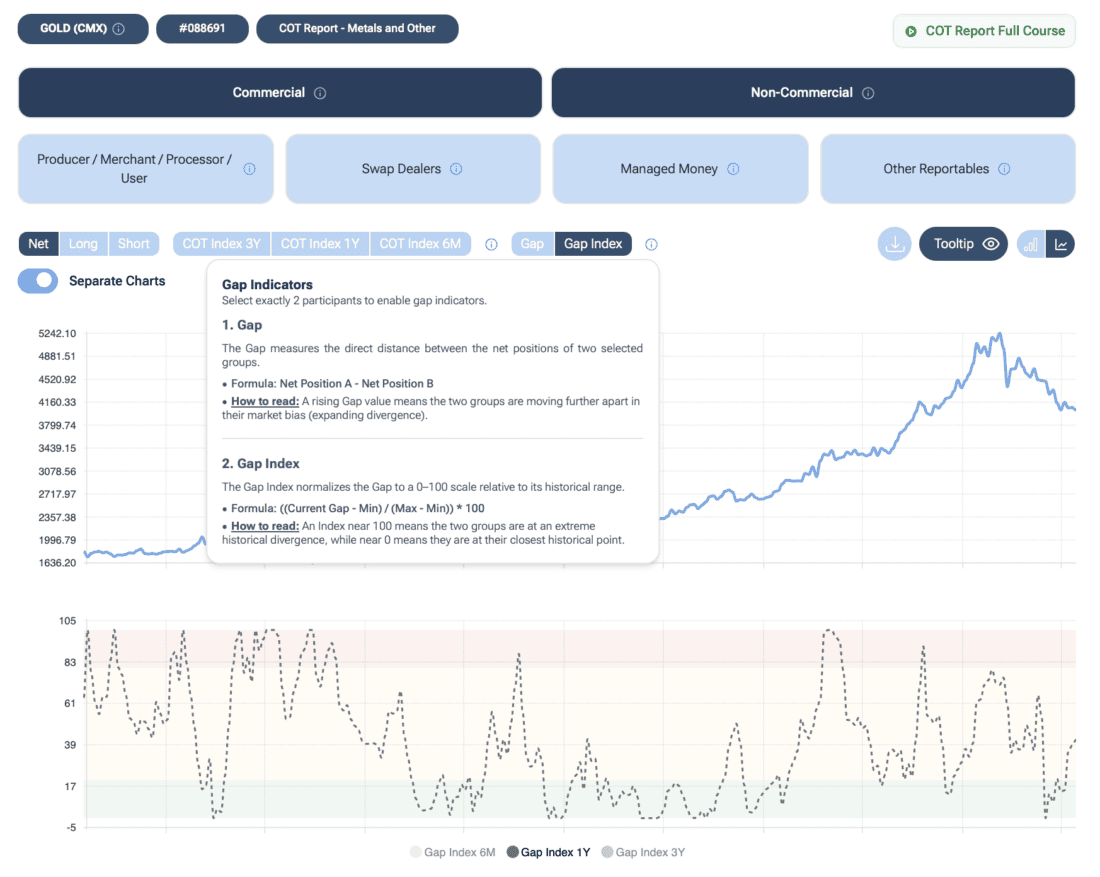
To quantify this relationship, Forecaster features the Gap Index, a powerful metric that calculates the exact difference (the gap) between these two distinct categories.
The rule here is incredibly straightforward: every single time the Gap Index reaches the absolute extremes of the chart, something major is about to happen in the market. Looking at historical data, whether it is a massive top or a devastating bottom, these turning points almost always align with extreme readings on the Gap Index. It acts as a definitive warning system. If you see prices making a new low and the Gap Index stretching to historical extremes, it is yet another profound confirmation that an important market bottom is currently forming.
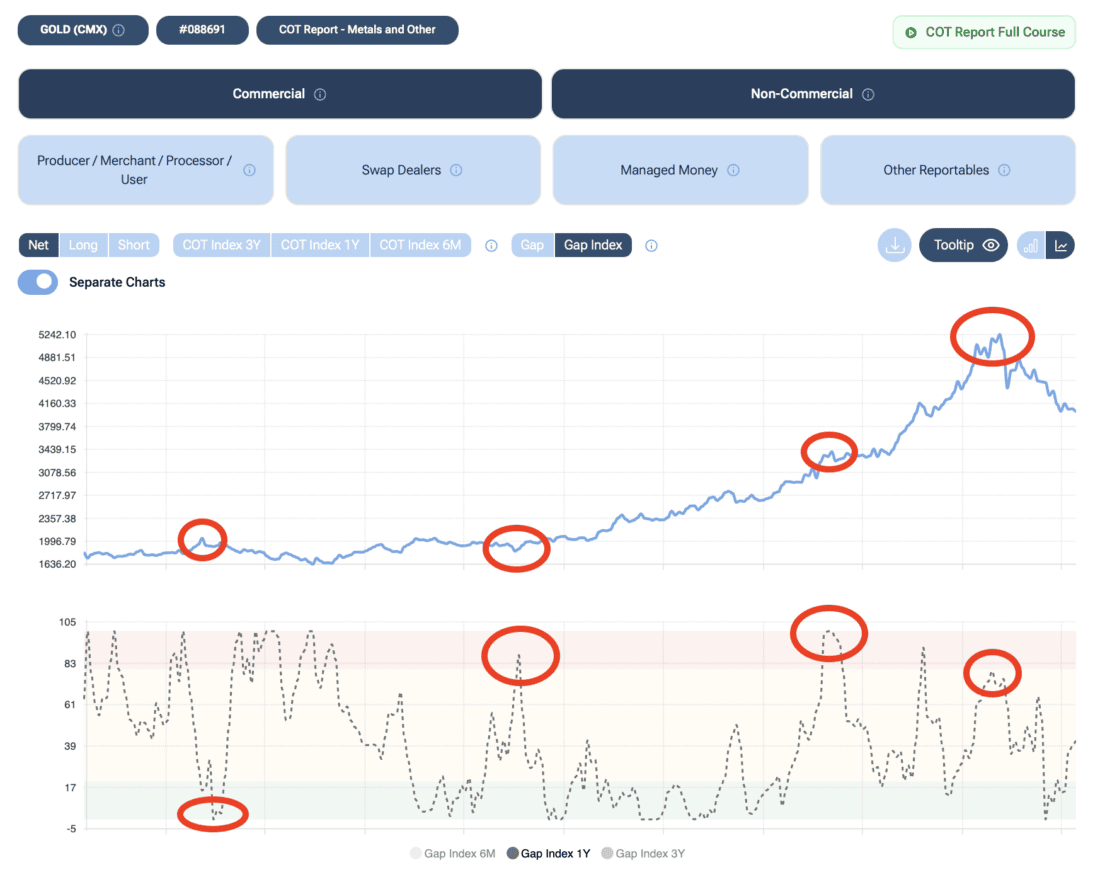
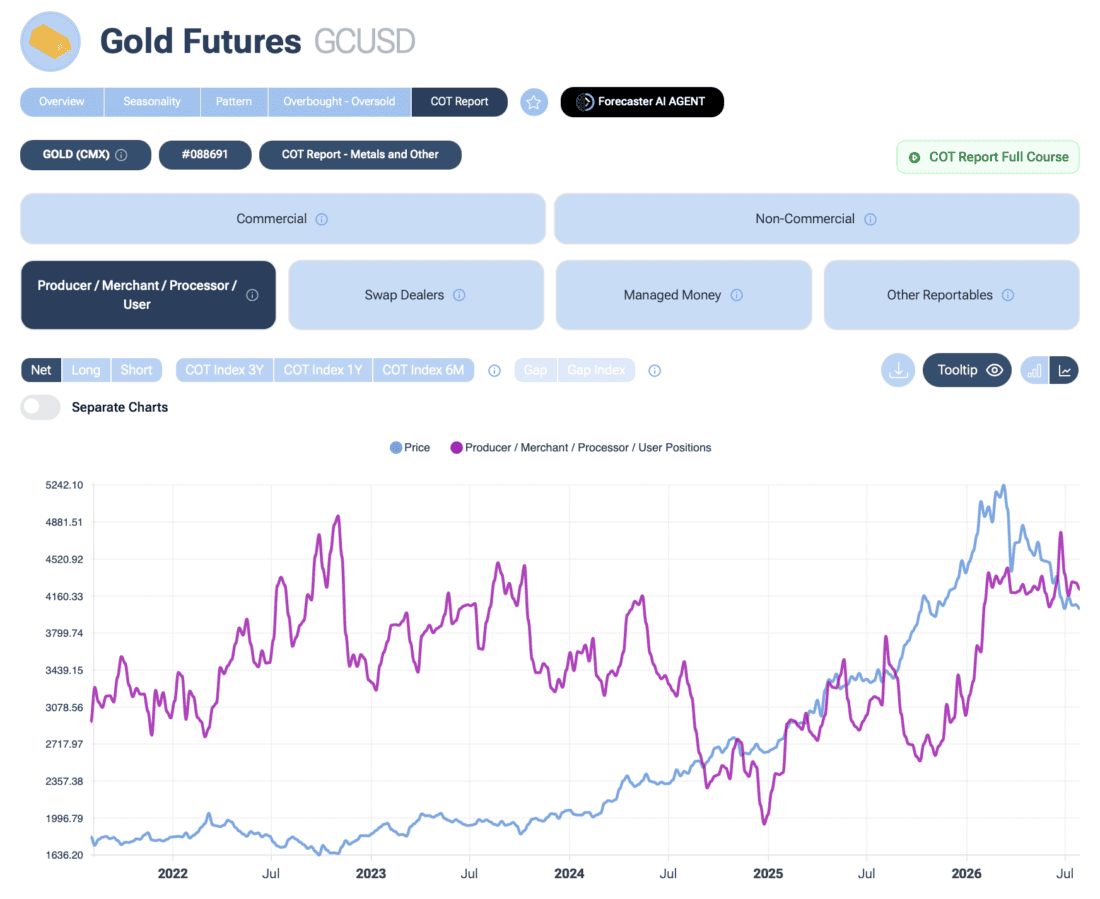
While the COT report is brilliant for equities, it offers borderline insider information when applied to commodities like Gold. When analyzing gold, we have a unique and incredibly important category to monitor: the producers (merchant processors).
These are the companies physically extracting gold from the earth. They know everything there is to know about the commodity. They know the exact cost of extraction and they hold the master key to supply and demand orders. Historically, producers use the futures market to protect themselves from price volatility. If they dig gold out of the ground today, it might take 30 days to refine and sell it. To ensure they don’t lose money if the price crashes during those 30 days, they open short positions on the futures market. Because of this constant need to hedge, the net positions of producers are historically negative.

However, sometimes the price of gold drops so low that the producers know it is fundamentally impossible for it to go any lower based on their extraction costs. When this happens, they stop hedging. They abandon their short positions and actually go long to speculate on the inevitable price increase.
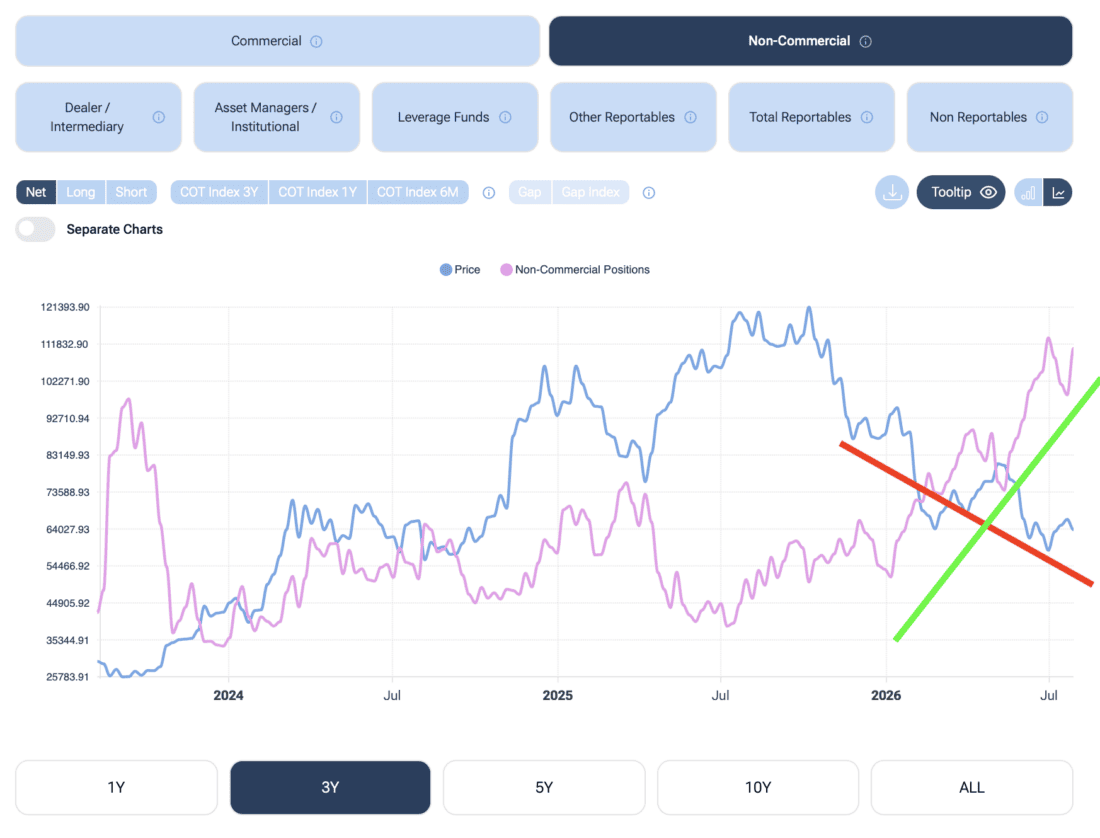
In 2022, we saw exactly this. Producers closed their shorts and started buying long positions heavily, anticipating the price to skyrocket. When we merged the chart, we saw a beautiful divergence: the price of gold was tumbling, but both producers and speculative traders were aggressively buying.
Of course, the COT report is not a perfect timing indicator on its own. That is exactly why we cross-reference it within Forecaster. During that exact gold setup, the Forecaster terminal’s seasonality tool showed that the price action had a 94% correlation to the massive bull run of 1999. Combining the statistical seasonality data with the extreme bullish positioning of the producers gave us a near-perfect signal that a historic bottom was in place. When you have precise signals like this, it becomes very difficult to lose money.

The exact same institutional logic applies to cryptocurrencies. If we open the Forecaster terminal and jump directly to the COT report for Bitcoin, we always start our analysis from a major historical top or bottom.
Following a major all-time high, we could clearly observe a severe downtrend in Bitcoin’s price. But by switching our attention to the net positions of the non-commercial speculative funds, the story changed completely. While the price was crashing, their net positions were steadily increasing.
Remember, these funds have too much capital to simply click “buy” once. They build their positions while the market is falling. They sold near the highs as the market rallied, and they systematically accumulated as the retail market panicked and pushed the price into lower lows. Price moving down, net positions moving up. Once again, this creates the perfect divergence and the ideal condition for a major, long-term market bottom in the crypto space.
The Forex market presents a unique challenge. The CFTC only provides COT data for individual currencies against the US Dollar. You cannot naturally find a COT report for cross pairs.

To solve this, we created Synthetic COT reports directly inside Forecaster. If you want to trade the Australian Dollar versus the Canadian Dollar (AUD/CAD), we take the raw COT report for the Australian Dollar, merge it mathematically with the COT report for the Canadian Dollar, and generate a brand new, highly accurate synthetic chart.
By analyzing the non-commercials on the AUD/CAD synthetic chart, you can look for the exact same divergences. In one of our past analyses, we noted that the net positions were at historic extreme highs—levels that had always triggered a market top in the past. When we merged the charts, we saw the price of AUD/CAD pushing upward, while both the non-commercials and the asset managers were actively decreasing their net positions.
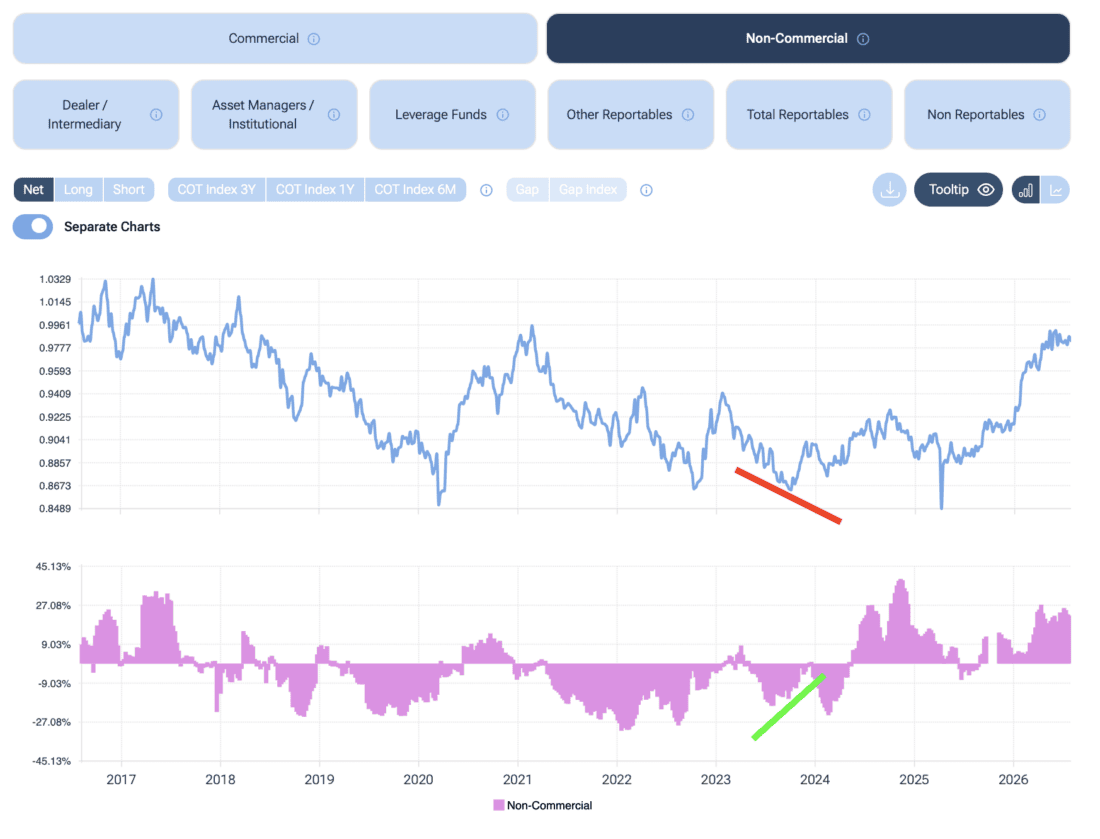
We had a massive divergence from two different institutional perspectives. It became immediately clear that it was no longer safe to hold long positions on that cross pair. By tracking the data, understanding the different time horizons of asset managers versus speculators, and utilizing advanced tools to visualize the hidden flow of capital, you can stop guessing and start trading with the smart money.
Navigating the financial markets without understanding where the big players are deploying their capital is essentially driving blindfolded. The COT report strips away the noise and the speculation, leaving you with cold, hard data about the actual flow of money.
However, raw data is useless without the proper tools to interpret it. By utilizing Forecaster to visualize these institutional footprints—whether through finding divergences, tracking the extreme limits of the Gap Index, or blending COT data with seasonality and fundamental analysis—you gain a massive analytical advantage.
You don’t need to predict the future to be a successful investor; you simply need to recognize when the institutions are quietly building their positions against the current price trend. Stop guessing what the market might do next, start analyzing the actual commitments of traders, and put the smart money to work for your own portfolio.
Information posted on IBKR Campus that is provided by third-parties does NOT constitute a recommendation that you should contract for the services of that third party. Third-party participants who contribute to IBKR Campus are independent of Interactive Brokers and Interactive Brokers does not make any representations or warranties concerning the services offered, their past or future performance, or the accuracy of the information provided by the third party. Past performance is no guarantee of future results.
This material is from Forecaster.biz and is being posted with its permission. The views expressed in this material are solely those of the author and/or Forecaster.biz and Interactive Brokers is not endorsing or recommending any investment or trading discussed in the material. This material is not and should not be construed as an offer to buy or sell any security. It should not be construed as research or investment advice or a recommendation to buy, sell or hold any security or commodity. This material does not and is not intended to take into account the particular financial conditions, investment objectives or requirements of individual customers. Before acting on this material, you should consider whether it is suitable for your particular circumstances and, as necessary, seek professional advice.
Futures are not suitable for all investors. The amount you may lose may be greater than your initial investment. Before trading futures, please read the CFTC Risk Disclosure. A copy and additional information are available at ibkr.com.
Short selling is an advanced trading strategy involving potentially unlimited risks and must be done in a margin account.
Trading on margin is only for experienced investors with high risk tolerance. You may lose more than your initial investment. For additional information regarding margin loan rates, see ibkr.com/interest
Hedge Funds are highly speculative, and investors may lose their entire investment.
Investments in certain commodities (precious metals) may be subject to significant price volatility and often involve risks related to market fluctuations, liquidity constraints, geopolitical events, and changes in global economic conditions that could adversely affect their value.
U.S. Spot Gold trading through IB LLC accounts is only available to legal residents of the United States that do not reside in Arizona, Montana, New Hampshire, and Rhode Island.
Trading in digital assets, including cryptocurrencies, is especially risky and is only for individuals with a high risk tolerance and the financial ability to sustain losses. Eligibility to trade in digital asset products may vary based on jurisdiction.
TRADING IN BITCOIN FUTURES IS ESPECIALLY RISKY AND IS ONLY FOR CLIENTS WITH A HIGH RISK TOLERANCE AND THE FINANCIAL ABILITY TO SUSTAIN LOSSES. More information about the risk of trading Bitcoin products can be found on the IBKR website. If you're new to bitcoin, or futures in general, see Introduction to Bitcoin Futures.
Trading Bitcoin involves significant risk. Bitcoin prices can be highly volatile and may fluctuate rapidly, potentially resulting in substantial losses. Because Bitcoin operates on a decentralized blockchain, network congestion or technical issues may occasionally delay transaction settlement. Regulatory frameworks for digital assets are still evolving and could impact availability, liquidity, or pricing. When trading through Interactive Brokers, execution and custody are facilitated by regulated partners such as Paxos or Zero Hash; however, these arrangements do not eliminate the possibility of operational or counterparty risk.
There is a substantial risk of loss in foreign exchange trading. The settlement date of foreign exchange trades can vary due to time zone differences and bank holidays. When trading across foreign exchange markets, this may necessitate borrowing funds to settle foreign exchange trades. The interest rate on borrowed funds must be considered when computing the cost of trades across multiple markets.
Spot currencies are not available at IBKR Singapore.
Related Articles

















Join The Conversation
For specific platform feedback and suggestions, please submit it directly to our team using these instructions.
If you have an account-specific question or concern, please reach out to Client Services.
We encourage you to look through our FAQs before posting. Your question may already be covered!