
- Solve real problems with our hands-on interface
- Progress from basic puts and calls to advanced strategies
Interactive Options Course

Posted January 29, 2025 at 10:02 am
The article “R Code Snippet: Transform from Long Format to Wide Format” was originally posted on SHLee AI Financial Model.
This post introduces a simple R code snippet for transforming the long format data to the wide format. We occasionally encounter the long format data such as yield curve data since it has two dimensions : maturity and time. For this end, we can use reshape() R built-in function.
What is the long and wide format? A picture paints a thousand words.

We want to transform the long format data to the wide format data for a panel of time series analysis such as a term structure of interest rates. As financial data is usually extracted from database system, we occasionally encounter the long format data. For example, the data in the above figure is a sample of Euro area yield curve which has the long format. To facilitate an empirical analysis, the wide format is appropriate.
Transforming between the long and wide format can be carried out by using reshape() R function. No further explanation is needed. Let’s see the R code below.
The following R code reads sample data and transform the long format to the wide format and vice versa. When using the reshape() function, we need to set the direction argument as “long” or “wide”. In particular, we need to add new column name with some delimitator (., _, etc) to the wide format data when we transform it to the long format.
#========================================================#
# Quantitative Financial Econometrics & Derivatives
# ML/DL using R, Python, Tensorflow by Sang-Heon Lee
#
# https://shleeai.blogspot.com
#--------------------------------------------------------#
# Long to wide format and vice versa for yield data
#========================================================#
graphics.off(); rm(list = ls())
# sample data : ECB zero yields
str_data <- "term date rate
3M 2021-01-29 -0.625
3M 2021-02-26 -0.612
3M 2021-03-31 -0.636
3M 2021-04-30 -0.628
3M 2021-05-31 -0.632
3M 2021-06-30 -0.650
3M 2021-07-30 -0.663
3M 2021-08-31 -0.676
3M 2021-09-30 -0.712
3M 2021-10-29 -0.736
3M 2021-11-30 -0.895
3M 2021-12-31 -0.731
3Y 2021-01-29 -0.771
3Y 2021-02-26 -0.648
3Y 2021-03-31 -0.711
3Y 2021-04-30 -0.684
3Y 2021-05-31 -0.666
3Y 2021-06-30 -0.672
3Y 2021-07-30 -0.813
3Y 2021-08-31 -0.760
3Y 2021-09-30 -0.677
3Y 2021-10-29 -0.537
3Y 2021-11-30 -0.766
3Y 2021-12-31 -0.620
10Y 2021-01-29 -0.512
10Y 2021-02-26 -0.246
10Y 2021-03-31 -0.279
10Y 2021-04-30 -0.180
10Y 2021-05-31 -0.146
10Y 2021-06-30 -0.203
10Y 2021-07-30 -0.440
10Y 2021-08-31 -0.393
10Y 2021-09-30 -0.170
10Y 2021-10-29 -0.069
10Y 2021-11-30 -0.350
10Y 2021-12-31 -0.188
20Y 2021-01-29 -0.176
20Y 2021-02-26 0.103
20Y 2021-03-31 0.142
20Y 2021-04-30 0.252
20Y 2021-05-31 0.287
20Y 2021-06-30 0.201
20Y 2021-07-30 -0.059
20Y 2021-08-31 -0.033
20Y 2021-09-30 0.195
20Y 2021-10-29 0.103
20Y 2021-11-30 -0.115
20Y 2021-12-31 0.056"
#==========================================
# Read a sample of ECB zero coupon yields
#==========================================
df_long <- read.table(text = str_data, header = TRUE)
#==========================================
# Transform LONG to WIDE format
#==========================================
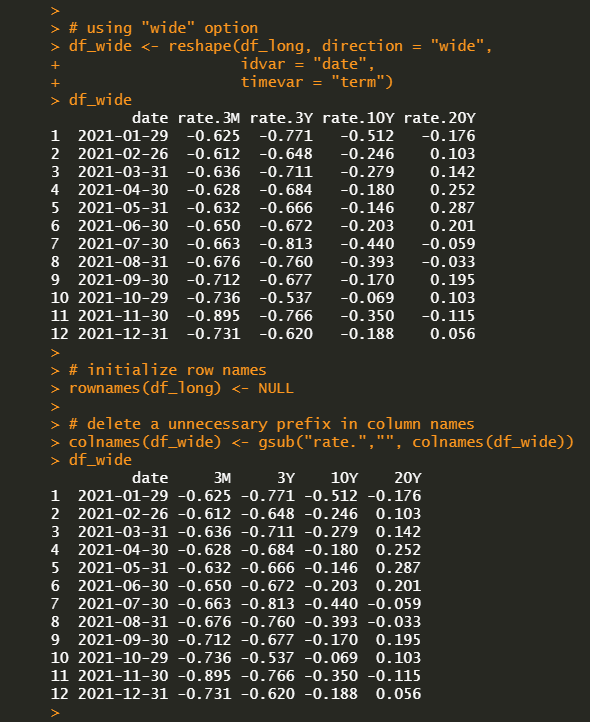
# using "wide" option
df_wide <- reshape(df_long, direction = "wide",
idvar = "date",
timevar = "term")
df_wide
# initialize row names
rownames(df_long) <- NULL
# delete a unnecessary prefix in column names
colnames(df_wide) <- gsub("rate.","", colnames(df_wide))
df_wide
#==========================================
# Transform WIDE to LONG format
#==========================================
df_wide2 <- df_wide
# need to add new column name as a prefix
colnames(df_wide2)[-1] <-
paste0("term.", colnames(df_wide)[-1])
# using "long" option
df_long2 <- reshape(df_wide2, direction = "long",
idvar="date",
varying = colnames(df_wide2)[-1],
sep = ".")
# initialize row names
rownames(df_long2) <- NULL
df_long2Running the above R code produces the following wide format of the yield curve data.
We can also transform the wide format data to the long format conversely.

Information posted on IBKR Campus that is provided by third-parties does NOT constitute a recommendation that you should contract for the services of that third party. Third-party participants who contribute to IBKR Campus are independent of Interactive Brokers and Interactive Brokers does not make any representations or warranties concerning the services offered, their past or future performance, or the accuracy of the information provided by the third party. Past performance is no guarantee of future results.
This material is from SHLee AI Financial Model and is being posted with its permission. The views expressed in this material are solely those of the author and/or SHLee AI Financial Model and Interactive Brokers is not endorsing or recommending any investment or trading discussed in the material. This material is not and should not be construed as an offer to buy or sell any security. It should not be construed as research or investment advice or a recommendation to buy, sell or hold any security or commodity. This material does not and is not intended to take into account the particular financial conditions, investment objectives or requirements of individual customers. Before acting on this material, you should consider whether it is suitable for your particular circumstances and, as necessary, seek professional advice.


Join The Conversation
For specific platform feedback and suggestions, please submit it directly to our team using these instructions.
If you have an account-specific question or concern, please reach out to Client Services.
We encourage you to look through our FAQs before posting. Your question may already be covered!