
- Solve real problems with our hands-on interface
- Progress from basic puts and calls to advanced strategies
Interactive Options Course

Posted January 15, 2026 at 12:20 pm
Most desks talk about “PnL attribution”, But very few stop to ask: what kind of attribution are we really doing?
PnL attribution is used to answer:
It decomposes portfolio PnL into components such as theta (time decay), delta (underlying move), gamma (convexity), and vega (volatility move). Beyond desk-level risk management, attribution is also used as a diagnostic for model quality: do the sensitivities explain realized PnL?
Idea: Move market variables one-by-one and reprice after each move. A typical sequence:
(t) → (S) → (σ) → (r) → · · ·
The incremental price change after each move is attributed to the variable moved at that step.
Key properties
Idea: Use start-of-day (or previous close) sensitivities and multiply by observed market moves:
ΔV ≈ Δ ΔS + ½ Γ(ΔS)² + ν Δσ + Θ Δt + · · ·
where Δ is delta, Γ gamma, ν vega, and Θ theta.
Key properties
Theta is not a market quote; it is the effect of time passing. In PnL Explain, the question “move time first or last?” matters because it changes the repricing state used for subsequent moves. In practice, firms adopt and enforce a convention to avoid inconsistent “mix-and-match” states that can destabilize repricing.
| Aspect | PnL Explain | PnL Predict |
|---|---|---|
| Method | Sequential repricing after moving variables one-by-one | Greeks × observed moves (local Taylor approximation) |
| Explains 100%? | Yes (by construction) | No (residual is expected) |
| Order sensitivity | Yes (depends on attribution path) | No (single expansion around a reference state) |
| Operational stability | Can be fragile if intermediate states are inconsistent | Stable; always produces a number |
| Typical use | Desk reporting, forensic analysis | Daily monitoring, hedge/model diagnostics |
Table 1: Conceptual comparison of PnL Explain and PnL Predict.
A common observation is that discrepancies between predicted and realized PnL often concentrate near-the-money (ATM), where options typically have the highest gamma. Gamma contributes a nonlinear term:
Gamma PnL ≈ ½ Γ(ΔS)²
If gamma is stale, mis-estimated, or higher-order effects matter, residuals often increase where convexity is largest.
Let Vt−1 be the reference price and Vt the price after the market move:
Realized PnL = Vt − Vt−1
A second-order PnL Predict approximation:
Predicted PnL = Δ ΔS + ½ Γ(ΔS)² + ν Δσ + Θ Δt
Residual definitions:
Residual = Realized PnL − Predicted PnL,
Residual % = (Residual / Realized PnL) × 100
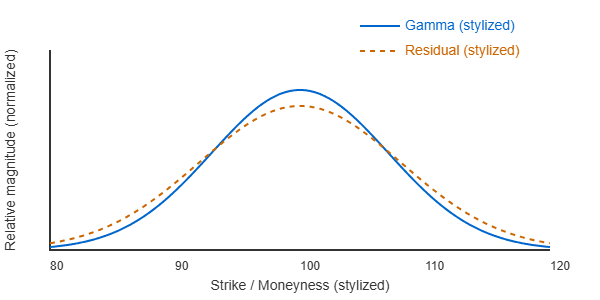
Figure 1: Stylized intuition: gamma peaks near ATM, and residuals often increase where convexity dominates.
The two methodologies often produce similar totals, but the internal decomposition can differ materially, especially in how convexity (gamma) and volatility (vega) effects appear.
| Component | ATM | OTM | ITM | Fly |
|---|---|---|---|---|
| PnL Explain (Sequential Repricing) | ||||
| Underlying (Delta) | 0.72 | 0.31 | 0.88 | – |
| Theta | -0.03 | -0.02 | -0.02 | – |
| Vega | -0.41 | -0.27 | -0.32 | – |
| Total Explained | 0.28 | 0.02 | 0.54 | – |
| Unexplained | 0.00 | 0.00 | 0.00 | – |
| PnL Predict (Greek-Based) | ||||
| Delta + Gamma | 0.71 | 0.32 | 0.87 | – |
| Theta | -0.03 | -0.02 | -0.02 | – |
| Vega | -0.39 | -0.28 | -0.31 | – |
| Total Predicted | 0.29 | 0.02 | 0.54 | – |
| Unexplained (Abs) | -0.01 | 0.002 | 0.004 | – |
| Unexplained (%) | -3.6% | 10.0% | 0.7% | – |
Table 2: PnL Explain vs PnL Predict: totals remain close, but component-level differences especially Gamma and Vega generate residuals.
Interpretation. PnL Explain reproduces the realized PnL exactly because it is constructed by sequentially repricing the portfolio through the chosen path of market moves. By design, all effects are fully allocated and no residual remains.
PnL Predict, in contrast, uses a local sensitivity (Greek-based) approximation around the initial state. It therefore captures the first-order and selected second-order effects of market moves, but cannot perfectly reproduce nonlinear or path-dependent behavior. As a result, small residuals are natural and informative rather than problematic.
In the table, the largest mismatch appears around ATM, where gamma is highest and convexity effects dominate. OTM and ITM options, with lower gamma, show much smaller discrepancies. Differences in Vega attribution also contribute, since volatility sensitivity itself changes as the underlying and time move.
Hence, the gap between explained and predicted PnL should be read as a diagnostic: small, stable residuals indicate a well-specified model and effective hedging, while growing or unstable residuals signal increasing nonlinearity, missing higher-order effects, or model–market inconsistency.
Information posted on IBKR Campus that is provided by third-parties does NOT constitute a recommendation that you should contract for the services of that third party. Third-party participants who contribute to IBKR Campus are independent of Interactive Brokers and Interactive Brokers does not make any representations or warranties concerning the services offered, their past or future performance, or the accuracy of the information provided by the third party. Past performance is no guarantee of future results.
This material is from Quant Insider and is being posted with its permission. The views expressed in this material are solely those of the author and/or Quant Insider and Interactive Brokers is not endorsing or recommending any investment or trading discussed in the material. This material is not and should not be construed as an offer to buy or sell any security. It should not be construed as research or investment advice or a recommendation to buy, sell or hold any security or commodity. This material does not and is not intended to take into account the particular financial conditions, investment objectives or requirements of individual customers. Before acting on this material, you should consider whether it is suitable for your particular circumstances and, as necessary, seek professional advice.
Options involve risk and are not suitable for all investors. For information on the uses and risks of options, you can obtain a copy of the Options Clearing Corporation risk disclosure document titled Characteristics and Risks of Standardized Options by going to the following link ibkr.com/occ. Multiple leg strategies, including spreads, will incur multiple transaction costs.


Join The Conversation
For specific platform feedback and suggestions, please submit it directly to our team using these instructions.
If you have an account-specific question or concern, please reach out to Client Services.
We encourage you to look through our FAQs before posting. Your question may already be covered!