
- Solve real problems with our hands-on interface
- Progress from basic puts and calls to advanced strategies
Interactive Options Course

Posted December 18, 2025 at 11:57 am
The post “Fibonacci Numbers – Harmonic Patterns” was originally published on QuantInsti blog.
In this blog, we learn about Fibonacci numbers, harmonic patterns, and how to find patterns of varying lengths and magnitudes. The trader can then apply Fibonacci ratios to the patterns and try to predict future movements.
This article is the final project submitted by the author as a part of his coursework in Executive Programme in Algorithmic Trading (EPAT™) at QuantInsti®. Do check our Projects page and have a look at what our students are building.
An EPATian, Sanjeet Kumar is based in Delhi, India and has an MBA in Finance from Sikkim Manipal University.
A Senior Analyst working at ThoughtFocus, he holds the EPAT Certificate of Excellence.
Harmonic trading combines patterns and math into a trading method that is precise and based on the premise that patterns repeat themselves. The primary ratio is found in almost all natural and environmental structures and events; it is also found in man-made structures. Since the pattern repeats throughout nature and within society, the ratio is also seen in the financial markets, which are affected by the environments and societies in which they trade.
By finding patterns of varying lengths and magnitudes, the trader can then apply Fibonacci ratios to the patterns and try to predict future movements. The trading method is largely attributed to Scott Carney, although others have contributed or found patterns and levels that enhance performance.
The Fibonacci numbers and lines are technical indicators using a mathematical sequence developed by the Italian mathematician Leonardo Fibonacci. Fibonacci numbers are a sequence of numbers, starting with zero and one, created by adding the previous two numbers. For example, the early part of the sequence is 0, 1, 1, 2, 3, 5, 8, 13, 21, 34, 55, 89, and 144.
Harmonic price patterns take geometric price patterns to the next level by using Fibonacci numbers to define precise turning points. Unlike other common trading methods, Harmonic trading attempts to predict future movements. Let’s look at some examples of how harmonic price patterns are used to trade currencies in the Forex market.
Harmonic trading combines patterns and math into a trading method that is precise and based on the premise that patterns repeat themselves. At the root of the methodology is the primary ratio, or some derivative of it (0.618 or 1.618). Complementing ratios include: 0.382, 0.50, 1.41, 2.0, 2.24, 2.618, 3.14 and 3.618.
The primary ratio is found in almost all natural and environmental structures and events; it is also found in man-made structures. Since the pattern repeats throughout nature and within society, the ratio is also seen in the financial markets, which are affected by the environments and societies in which they trade.
By finding patterns of varying lengths and magnitudes, the trader can then apply Fibonacci ratios to the patterns and try to predict future movements. The harmonic trading method is largely attributed to Scott Carney, although others have contributed or found patterns and levels that enhance performance.
Harmonic price patterns are precise, requiring the pattern to show movements of a particular magnitude in order for the unfolding of the pattern to provide an accurate reversal point. A trader may often see a pattern that looks like a harmonic pattern, but the Fibonacci levels will not align in the pattern, thus rendering the pattern unreliable in terms of the harmonic approach. This can be an advantage, as it requires the trader to be patient and wait for ideal set-ups.
Harmonic patterns can gauge how long current moves will last, but they can also be used to isolate reversal points. The danger occurs when a trader takes a position in the reversal area and the pattern fails. When this happens, the trader can be caught in a trade where the trend rapidly extends against him. Therefore, as with all trading strategies, risk must be controlled.
It is important to note that patterns may exist within other patterns, and it is also possible that non-harmonic patterns may (and likely will) exist within the context of harmonic patterns. These can be used to aid in the effectiveness of the harmonic pattern and enhance entry and exit performance.
Several price waves may also exist within a single harmonic wave (for instance, a CD wave or AB wave). Prices are constantly gyrating; therefore, it is important to focus on the bigger picture of the time frame being traded. The fractal nature of the markets allows the theory to be applied from the smallest to largest time frames.
To use the method, a trader will benefit from a charting platform that allows him to plot multiple Fibonacci retracements to measure each wave.
There is quite an assortment of harmonic patterns which can be used for harmonic trading, although there are four that seem most popular. These are the Gartley, Butterfly, Bat, and Crab patterns.
The Gartley was originally published by H.M. Gartley in his book ‘Profits in the Stock Market’ and the Fibonacci levels were later added by Scott Carney in his book ‘The Harmonic Trader’. The levels discussed below are from that book. Over the years, other traders have come up with some other common ratios. When relevant, those are mentioned as well.
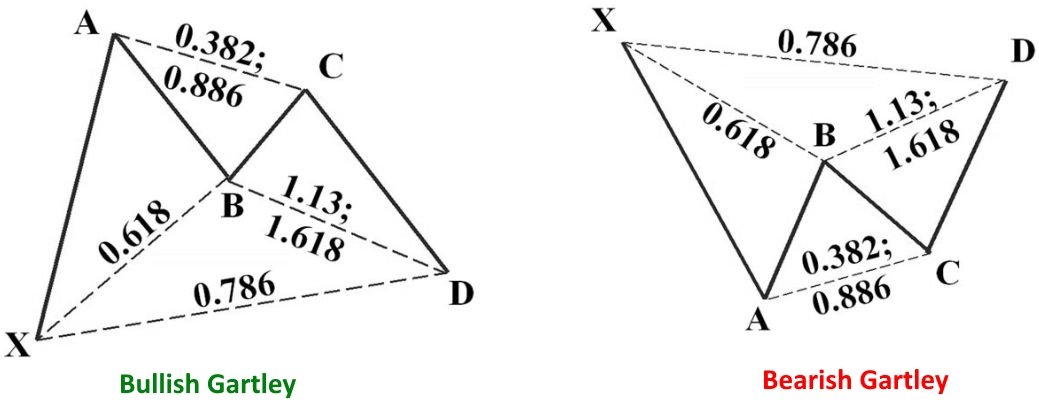
The bullish pattern is often seen early in a trend, and it is a sign the corrective waves are ending and an upward move will ensue following point D. All patterns may be within the context of a broader trend or range and traders must be aware of that. (For related insight, see “Elliott Wave Theory”).
It’s a lot of information to absorb, but this is how to read the chart. We will use the bullish example.
The price moves up to A, it then corrects and B is a 0.618 retracement of wave A.
The price moves up via BC, and is a 0.382 to 0.886 retracement of AB.
The next move is down via CD, and it is an extension of 1.13 to 1.618 of AB.
Point D is a 0.786 retracement of XA. Many traders look for CD to extend 1.27 to 1.618 of AB.
The area at D is known as the potential reversal zone. This is where long positions could be entered, although waiting for some confirmation of the price starting to rise is encouraged. A stop loss is placed not far below entry, although addition stop-loss tactics are discussed in a later section.
For the bearish pattern, look to short trade near D, with a stop loss not far above.
The butterfly pattern is different from the Gartley in that the butterfly has point D extending beyond point X.
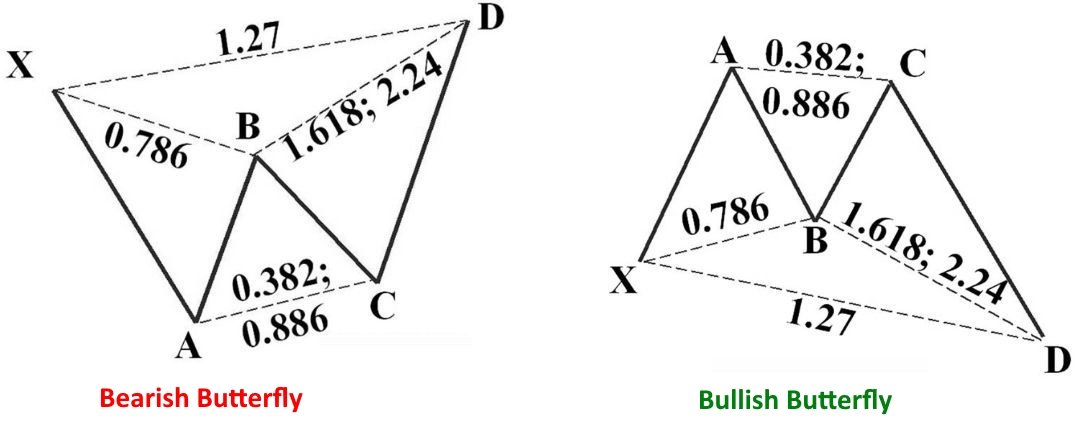
Here we will look at the bearish example to break down the numbers.
The price is dropping to A.
The up wave of AB is a 0.786 retracement of XA.
BC is a 0.382 to 0.886 retracement of AB.
CD is a 1.618 to 2.24 extension of AB.
D is at a 1.27 extension of the XA wave.
D is an area to consider a short trade, although waiting for some confirmation of the price starting to move lower is encouraged. Place a stop loss not far above.
With all these patterns, some traders look for any ratio between the numbers mentioned, while others look for one or the other. For example, above it was mentioned that CD is a 1.618 to 2.24 extension of AB. Some traders will only look for 1.618 or 2.24, and disregard numbers in between unless they are very close to these specific numbers.
The bat pattern is similar to Gartley in appearance, but not in measurement.
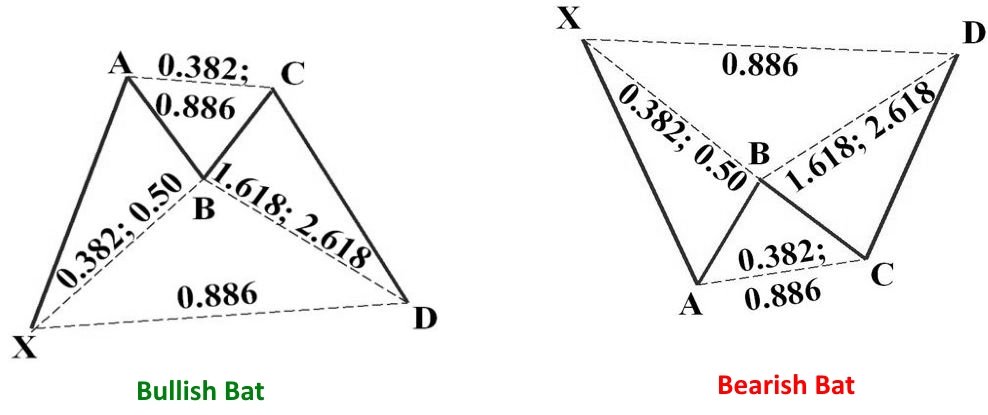
Let’s look at the bullish example.
There is a rise via XA.
B retraces 0.382 to 0.5 of XA.
BC retraces 0.382 to 0.886 of AB.
CD is a 1.618 to 2.618 extension of AB.
D is at a 0.886 retracement of XA.
D is the area to look for a long, although wait for the price to start rising before doing so. A stop loss can be placed not far below.
For the bearish pattern, look to short near D, with a stop loss not far above.
The crab is considered by Carney to be one of the most precise of the patterns, providing reversals in extremely close proximity to what the Fibonacci numbers indicate.

This pattern is similar to the butterfly, yet different in measurement.
In a bullish pattern, point B will pullback 0.382 to 0.618 of XA.
BC will retrace 0.382 to 0.886 of AB.
CD extends 2.618 to 3.618 of AB.
Point D is a 1.618 extension of XA.
Take longs near D, with a stop loss not far below.
For the bearish pattern, enter a short near D, with a stop loss not far above.
Each pattern provides a potential reversal zone (PRZ), and not necessarily an exact price. This is because two different projections are forming point D. If all projected levels are within close proximity, the trader can enter a position in that area. If the projection zone is spread out, such as on longer-term charts where the levels may be 50 pips or more apart, look for some other confirmation of the price moving in the expected direction. This could be from an indicator, or simply watching price action trading.
A stop loss can also be placed outside the furthest projection. This means the stop loss is unlikely to be reached unless the pattern invalidates itself by moving too far.
Harmonic trading is a precise and mathematical way to trade, but it requires patience, practice, and a lot of studies to master the patterns. The basic measurements are just the beginning. Movements that do not align with proper pattern measurements invalidate a pattern and can lead traders astray.
The Gartley, Butterfly, Bat, and Crab are the better-known patterns that traders watch for. Entries are made in the potential reversal zone when price confirmation indicates a reversal, and stop losses are placed just below a long entry or above a short entry, or alternatively outside the furthest projection of the pattern.
Visit QuantInsti for additional insights on this topic.
Information posted on IBKR Campus that is provided by third-parties does NOT constitute a recommendation that you should contract for the services of that third party. Third-party participants who contribute to IBKR Campus are independent of Interactive Brokers and Interactive Brokers does not make any representations or warranties concerning the services offered, their past or future performance, or the accuracy of the information provided by the third party. Past performance is no guarantee of future results.
This material is from QuantInsti and is being posted with its permission. The views expressed in this material are solely those of the author and/or QuantInsti and Interactive Brokers is not endorsing or recommending any investment or trading discussed in the material. This material is not and should not be construed as an offer to buy or sell any security. It should not be construed as research or investment advice or a recommendation to buy, sell or hold any security or commodity. This material does not and is not intended to take into account the particular financial conditions, investment objectives or requirements of individual customers. Before acting on this material, you should consider whether it is suitable for your particular circumstances and, as necessary, seek professional advice.
Please keep in mind that the examples discussed in this material are purely for technical demonstration purposes, and do not constitute trading advice. Also, it is important to remember that placing trades in a paper account is recommended before any live trading.
There is a substantial risk of loss in foreign exchange trading. The settlement date of foreign exchange trades can vary due to time zone differences and bank holidays. When trading across foreign exchange markets, this may necessitate borrowing funds to settle foreign exchange trades. The interest rate on borrowed funds must be considered when computing the cost of trades across multiple markets.
The order types available through Interactive Brokers LLC's trading platforms are designed to help you limit your loss and/or lock in a profit. Market conditions and other factors may affect execution. In general, orders guarantee a fill or guarantee a price, but not both. In extreme market conditions, an order may either be executed at a different price than anticipated or may not be filled in the marketplace.
Short selling is an advanced trading strategy involving potentially unlimited risks and must be done in a margin account.
Trading on margin is only for experienced investors with high risk tolerance. You may lose more than your initial investment. For additional information regarding margin loan rates, see ibkr.com/interest


Join The Conversation
For specific platform feedback and suggestions, please submit it directly to our team using these instructions.
If you have an account-specific question or concern, please reach out to Client Services.
We encourage you to look through our FAQs before posting. Your question may already be covered!