
- Solve real problems with our hands-on interface
- Progress from basic puts and calls to advanced strategies
Interactive Options Course
For decades, managing sorghum price risk has meant one thing: Corn futures. Growers, elevators, exporters, feeders and traders alike have leaned on the corn market for good reason. Corn and sorghum grow on the same calendar, often on neighboring fields, and compete for the same spot in a feed ration. Over the long term, their prices move nearly in lockstep, and a Corn futures hedge does a respectable job of protecting the value of sorghum bushels.
The key phrase, however, is long term. In the years when sorghum diverges from corn, and they do, the corn hedge loses its effectiveness at precisely the moment it is needed most. That gap is what a new Sorghum contract from CME Group is designed to close. To understand how, it helps to go back to basis.
Basis is one of the oldest ideas in grain marketing: It is calculated as the value between the local cash price and the futures price. For corn, the basis mostly reflects geography, storage and freight costs, nearby supply and demand and the strength of local buying from ethanol plants and feed yards. Futures carry the broad market move; basis carries the local story.
Sorghum basis has to carry something extra. With no Sorghum futures contract, sorghum was priced off Corn futures, so its basis bundled the usual local story together with the difference in value between two entirely different crops. That second piece is called cross-commodity basis, and until now, there was no direct way to manage it.
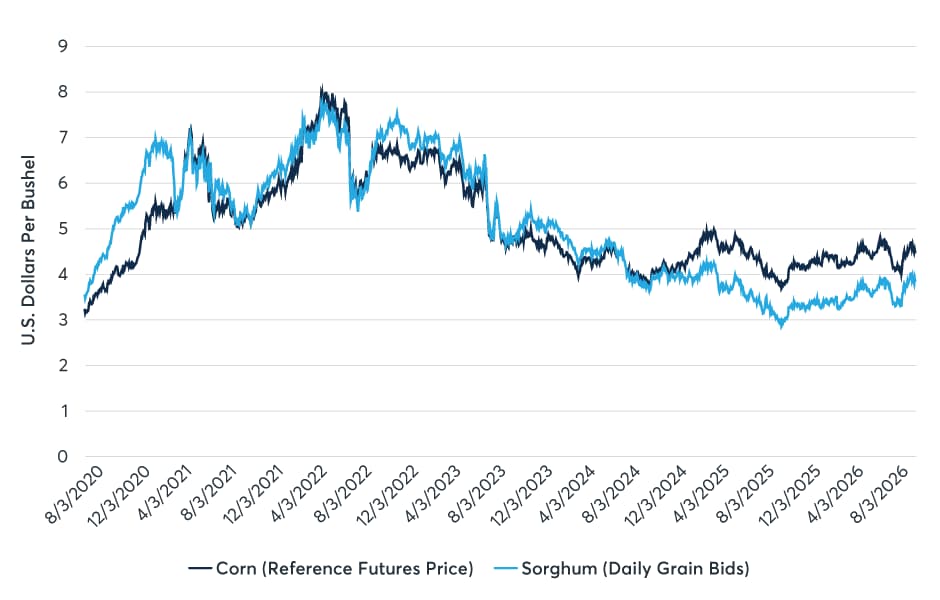
Both the partnership and the problem are visible in Figure 1, which plots six years of daily sorghum cash bids at central Kansas terminal elevators against the Corn futures price those bids reference. Through much of 2021 to 2023, the two lines are hard to tell apart. That close relationship is what made the corn cross-hedge workable. The two ends of the chart, however, tell a different story. In late 2020 and 2021, sorghum bids climbed well above Corn futures, and from mid-2024 on, sorghum slid to a deep, persistent discount. These gaps open, widen, and even change sign; that is cross-commodity basis in action, and no Corn futures position can cover it.
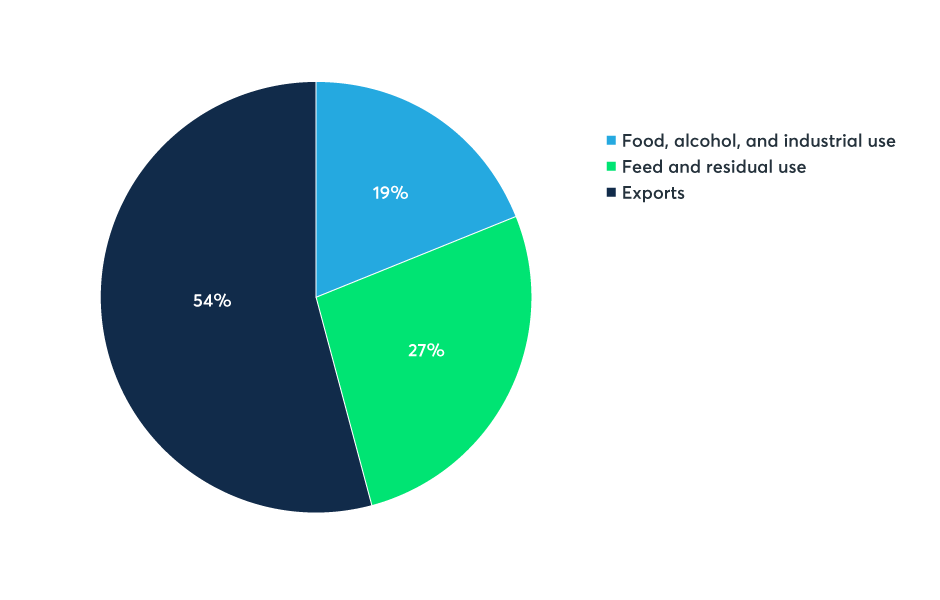
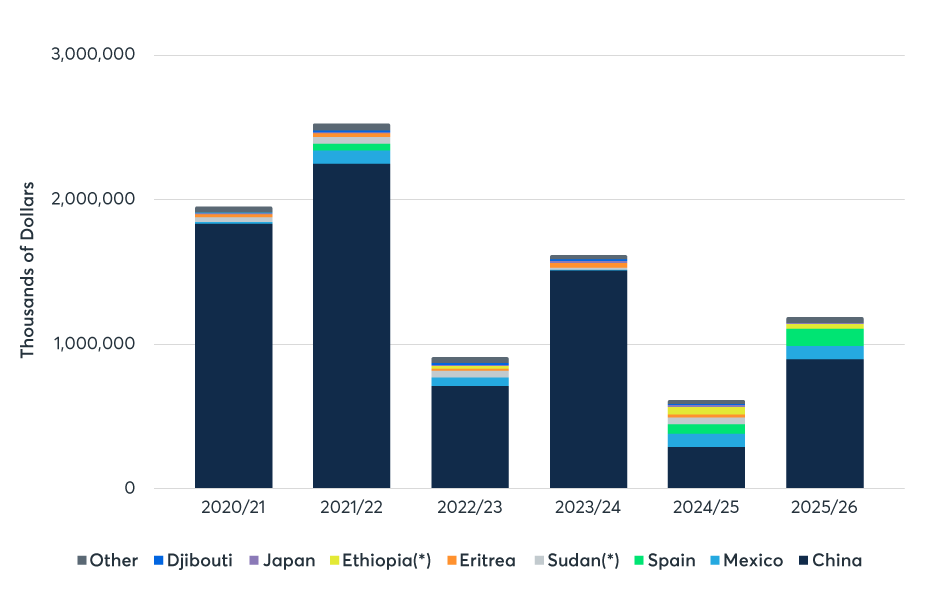
The answer starts with where sorghum goes after harvest. As Figure 2 shows, over the last nine marketing years, an average of 54% of the U.S. sorghum crop was exported. Corn, by comparison, sends only around 15% of its crop abroad. Its demand base is broad and domestic, while sorghum’s is narrow and offshore. And offshore mostly means one buyer. Figure 3 breaks out export value by destination, and the picture is unmistakable: China dwarfs every other destination in every year, and Chinese demand swings sharply. When Chinese buyers surged into the market in 2020/21 and 2021/22, they bid sorghum to a premium over corn. When they stepped back sharply in 2022/23 and again in 2024/25, sorghum sank to a discount. Importantly, the hedging problem cuts both ways: A surge hurts the end user or exporter who is short physical sorghum and an exit hurts the grower or elevator who is long physical sorghum. In either case, Corn futures failed to react, and the hedge offered less protection.
Geography deepens the split. Sorghum is a western grain belt crop concentrated in Kansas, Texas and Oklahoma, where drought risk runs higher, and it moves to port by rail toward the Texas Gulf and Mexico. Corn futures, by contrast, are anchored to barge delivery on the Illinois waterway in the eastern corn belt. Different weather, different buyers and different transportation systems leave ample room for the two prices to diverge.
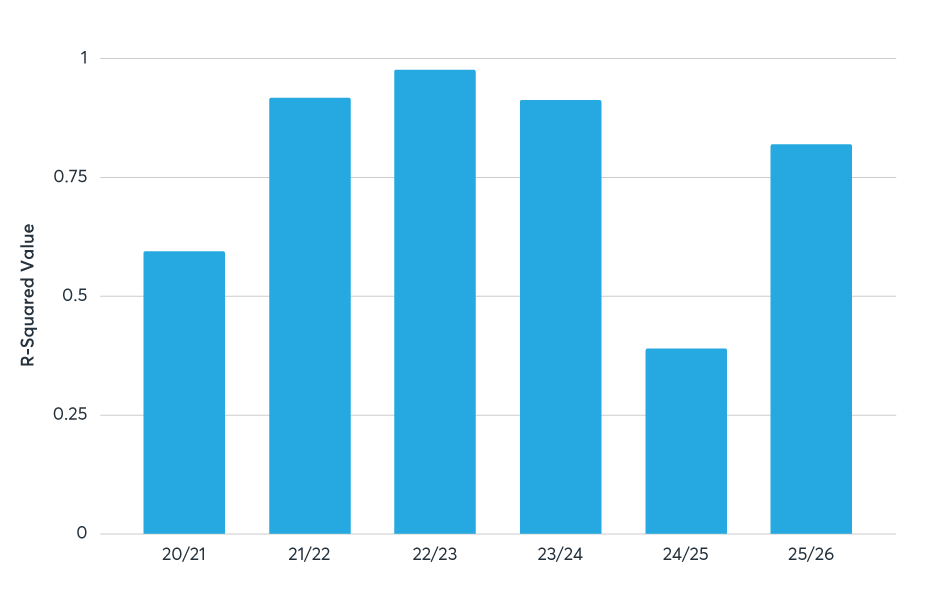
How much of sorghum’s price movement does corn actually explain? A simple regression of those daily Kansas sorghum bids on Corn futures provides an answer year by year. In Figure 4, the R² statistic can be read as a percentage: the share of sorghum’s price variation that corn accounts for. In the steadier middle years, corn explains 90% or more of sorghum’s price movement, and a corn hedge covered most of the risk. But in 2020/21, as Chinese buying surged, the figure dropped to about 59%, and in 2024/25, with China largely absent, it fell to 38%, meaning more than 60% of sorghum’s price risk fell outside the reach of a corn hedge.
While a full-year R² of 90% suggests a corn cross-hedge is highly effective, that annual average can hide shorter-term gaps. Figure 5 overlays the marketing year R² against a rolling 30-day R², and the intra-year timeline tells a different story. First, the relationship frequently weakens at the boundaries of the marketing year, reflecting the transition from old-crop to new-crop pricing. With sorghum moving by rail to the Texas Gulf and corn anchored to the eastern barge network, local supply shifts during harvest leave ample room for the two prices to temporarily diverge.
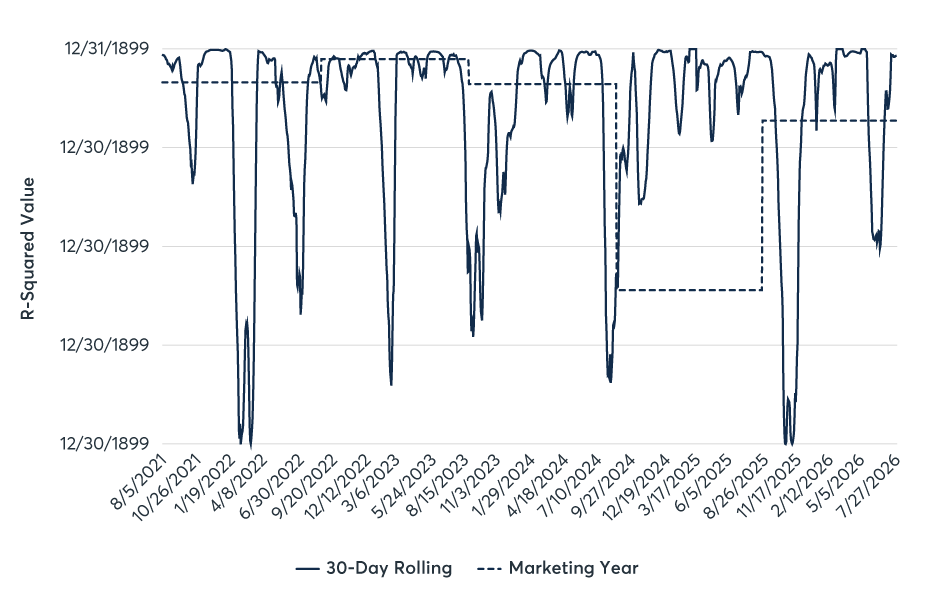
The larger issue happens right in the middle of seemingly stable years. During the 2021/22 and 2022/23 marketing years, the full-year R² sat securely above 90%, yet the 30-day correlation broke down mid year. These drops map directly to sorghum’s unique fundamentals. In 2021/22, surging Chinese demand disconnected the short-term relationship as export values outpaced domestic feed values. Conversely, the mid-year gap in 2022/23 aligns with a sharp pullback from Chinese buyers and localized drought in the western grain belt. In both cases, sorghum traded its own local and export story, and Corn futures failed to react.
For a grower or elevator needing to price grain during one of those 30-day windows, an annual correlation of 90% offers little comfort. The corn cross-hedge loses its effectiveness at precisely the moment it is needed most. That gap is exactly what the new CME Group contract is designed to solve.
A new Sorghum contract from CME Group takes a pragmatic approach to this problem. Rather than launching a stand-alone Sorghum futures contract and asking it to build liquidity from scratch, the contract is quoted as a differential to Corn futures.
It trades the sorghum – corn spread itself. The corn leg of sorghum’s price risk stays in the deepest, most liquid grain market in the world, while the sorghum-specific leg, the piece Figures one through four show going unmanaged, finally gets a market of its own. That structure also makes it easier for market makers to participate, which helps keep bid-ask spreads tight for everyone else.
For growers and elevators, that means protection when sorghum sinks to a discount; for exporters and end users, protection when it runs to a premium; and for the whole market, something sorghum has never had: a public, transparent price for sorghum’s own fundamentals.
Corn futures were never the wrong tool; they were an incomplete one. With a market for the sorghum – corn basis itself, the toolbox is finally complete.
—
August 28, 2026 – Back to Basis
All examples in this report are hypothetical interpretations of situations and are used for explanation purposes only. The views in this report reflect solely those of the author and not necessarily those of CME Group or its affiliated institutions. This report and the information herein should not be considered legal advice, investment advice or the results of actual market experience. Where regulatory matters are summarized, they represent CME Group’s good faith understanding of the applicable requirements.
© [2023] CME Group Inc. All rights reserved. This information is reproduced by permission of CME Group Inc. and its affiliates under license. CME Group Inc. and its affiliates accept no liability or responsibility for the information contained herein, including but not limited to the currency, accuracy and/or completeness of this information, and delays, interruptions, errors or omissions. This information is an unofficial copy and may not reflect the official and accurate version. For the definitive and up-to-date version of any of this information, please see cmegroup.com.
Information posted on IBKR Campus that is provided by third-parties does NOT constitute a recommendation that you should contract for the services of that third party. Third-party participants who contribute to IBKR Campus are independent of Interactive Brokers and Interactive Brokers does not make any representations or warranties concerning the services offered, their past or future performance, or the accuracy of the information provided by the third party. Past performance is no guarantee of future results.
This material is from CME Group and is being posted with its permission. The views expressed in this material are solely those of the author and/or CME Group and Interactive Brokers is not endorsing or recommending any investment or trading discussed in the material. This material is not and should not be construed as an offer to buy or sell any security. It should not be construed as research or investment advice or a recommendation to buy, sell or hold any security or commodity. This material does not and is not intended to take into account the particular financial conditions, investment objectives or requirements of individual customers. Before acting on this material, you should consider whether it is suitable for your particular circumstances and, as necessary, seek professional advice.
Futures are not suitable for all investors. The amount you may lose may be greater than your initial investment. Before trading futures, please read the CFTC Risk Disclosure. A copy and additional information are available at ibkr.com.
Related Articles













Join The Conversation
For specific platform feedback and suggestions, please submit it directly to our team using these instructions.
If you have an account-specific question or concern, please reach out to Client Services.
We encourage you to look through our FAQs before posting. Your question may already be covered!