
- Solve real problems with our hands-on interface
- Progress from basic puts and calls to advanced strategies
Interactive Options Course

Posted July 6, 2026 at 1:07 pm
(Today’s musical accompaniment: Billy Preston)
For better or worse, the questions I’m asked give me good insight into the topics that are pervasive in financial media. Many of the ones I’ve been fielding recently involve rotation, the movement of money from one sector to another. It is quite normal for investors to seek stocks that might offer better values than the current market leaders. It becomes trickier when relentless momentum continues to push those leaders higher regardless of value hunting.
At this point, it is important to remember some important features of momentum-based trading. In its basic form, it involves identifying a rising trend and riding it higher, using modest pullbacks as opportunities to add to positions. That can be done quite simply with moving averages, or in a more sophisticated manner with more advanced or proprietary indicators. As time-tested strategies go, these can be relatively easy to implement. Heck, you can now utilize AI models to help craft a strategy and link it to your IBKR account.
Because these strategies are both quite popular and relatively simple, they tend to become self-reinforcing when markets are trending higher. The longer a trend persists, the more fashionable it becomes, and because trend-following strategies don’t take valuations into account, they can become overextended. When taken to an extreme, that can lead to overcrowding, and it becomes increasingly difficult to determine when standard pullbacks have morphed into turning points. If combined with genuine changes in market leadership, this can lead to some important disruptions.
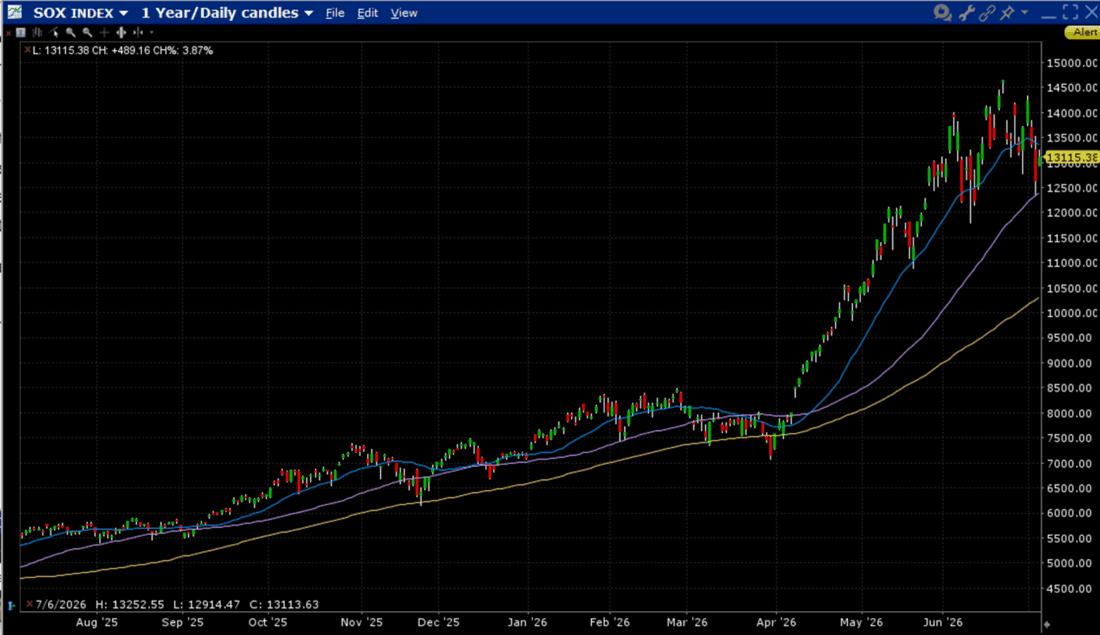
The currently most popular momentum-based strategies clearly involve semiconductor stocks. The performance of the Philadelphia Semiconductor Index (SOX) has been nothing short of spectacular in recent months. Yet after a nearly vertical rally, we have seen choppiness in recent sessions. We can’t, of course, analyze every moving average or technical indicator here, but a quick glance at some popular ones shows some variations in recent trends. The 20-day moving average has turned lower, if only recently, while the 50-day moving average held as support when tested on Thursday. Is this chart displaying a turning point, or a pullback amid a broader trend? That depends on the viewers and their biases.
SOX, 1-Year Daily Candles with 20-Day (blue line), 50-Day (purple), and 100-Day (yellow) Moving Averages
Source: Interactive Brokers
If money is indeed flowing out of tech stocks, then presumably it is flowing somewhere else. Recently we have seen several days, including today, where the sectoral performance can be summed up as tech up/down and almost everything else down/up. That said, we have seen Industrials and Financials – two economically sensitive sectors – doing better than most. In fact, we see those two sectors rising today as tech lifts and everything else is lower.
One way that we see the rotation playing out is via correlation and dispersion indices. We often like to view the Cboe Volatility Index (VIX) against that exchange’s Dispersion Index (DSPX) and 1-Month Correlation Index (COR1M). Bear in mind that correlation and dispersion tend to move in opposite directions – they can broadly be thought of as two sides of a similar coin – and that index volatility measures are influenced by the correlation of returns between that index’s components (if components are moving in opposite directions, that dampens volatility, and vice versa). Thus, it is notable to see that while COR1M is at a 1-year low (except for a spurious dip in October) and DSPX is at a 1-year high, VIX has failed to follow COR1M to those depths.
1-Year, COR1M (red/green candles), VIX (purple line), DSPX (blue line)

Source: Interactive Brokers
Situations like that have tended to resolve themselves with COR1M, and hence VIX, rising. Since rising VIX levels tend to accompany nervous markets, it is useful to consider the probability that rotation, while often benign, can lead to larger dislocations in an otherwise seemingly complacent market. For today, though, many investors appear content to continue following the longer-term momentum in the tech sector.
New to Interactive Brokers?
Open AccountAlready an Interactive Brokers Client?
Request Trading PermissionThe analysis in this material is provided for information only and is not and should not be construed as an offer to sell or the solicitation of an offer to buy any security. To the extent that this material discusses general market activity, industry or sector trends or other broad-based economic or political conditions, it should not be construed as research or investment advice. To the extent that it includes references to specific securities, commodities, currencies, or other instruments, those references do not constitute a recommendation by IBKR to buy, sell or hold such investments. This material does not and is not intended to take into account the particular financial conditions, investment objectives or requirements of individual customers. Before acting on this material, you should consider whether it is suitable for your particular circumstances and, as necessary, seek professional advice.
The views and opinions expressed herein are those of the author and do not necessarily reflect the views of Interactive Brokers, its affiliates, or its employees.
Related Articles
















Join The Conversation
For specific platform feedback and suggestions, please submit it directly to our team using these instructions.
If you have an account-specific question or concern, please reach out to Client Services.
We encourage you to look through our FAQs before posting. Your question may already be covered!