
- Solve real problems with our hands-on interface
- Progress from basic puts and calls to advanced strategies
Interactive Options Course

Posted June 23, 2026 at 1:13 pm
A circuit breaker selloff in South Korea is extending to US tech stocks because investors are worried that the AI rally may be due for a breather. The volatility is centered on memory providers, an area that has carried the lion’s share of equity gains this year, as a local report signaled that chip maker SK Hynix is redirecting its efforts to cheaper, interchangeable products. The adverse development coincides with certain notable customers recently complaining that the technologies have become unreasonably expensive, which is raising slowdown anxiety tied to the potential for firms to increasingly limit capital expenditures. But sinking interest rates alongside upbeat economic data stemming from ADP’s weekly jobs print and this month’s flash PMIs from S&P Global are bolstering cyclical equities, even though the Dow Jones is the only major benchmark advancing against the backdrop of 7 of the 11 principal sectors climbing. Despite yields falling in response to this morning’s publications depicting an outlook of softening price pressures, the greenback is much stronger, as its safe-haven characteristics offset the bearish currency impact of lightening borrowing costs. Risk-off sentiments are also prevalent in the retreating cryptocurrency and commodity complexes amidst rising hedging demand with index downside protection instruments seeing heavier premiums. Elsewhere, prediction markets are catching bids.
Economic activity is increasingly being carried by manufacturing as weak consumer sentiment driven by heavy cost pressures and elevated interest rates weighs on the services industry. This morning’s June Flash Purchasing Managers’ Index (PMI) from S&P Global printed the strongest factory expansion in 49 months of 55.7. Robust ordering, buoyant output yields and sharp inventory builds coincided with slower delivery times in light of a leaner workforce and firm transaction flows. The print surpassed the 54.8 expected and 55.1 from the prior period. Services improved only slightly as sluggish shopper momentum supported a figure of 51.3, loftier than both the 51 projected and the 50.7 in May. Business outlooks were better in both segments. Survey respondents cheered cheaper oil prices amidst substantial progress made on the US-Iran front. They also reacted positively to an uptick in relative certainty while lowering future inflation expectations.

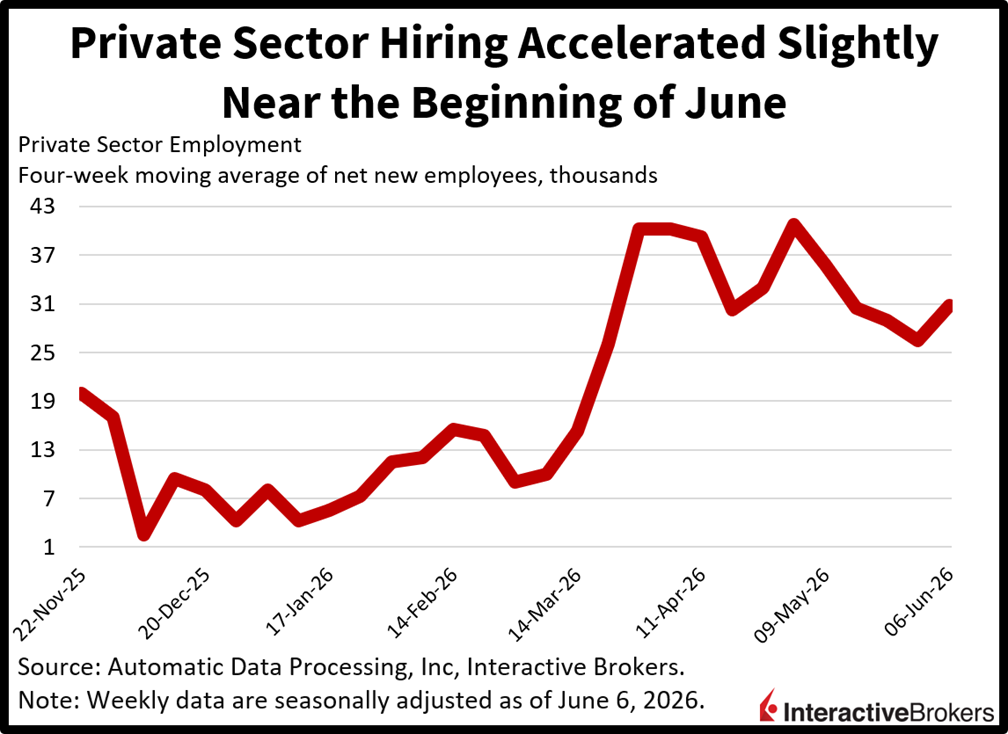
Private sector hiring accelerated at the beginning of the month as a pickup in economic activity continued to support a rebound in job growth. Businesses added an average of 30.75k employees in each of the four weeks during the period that ended June 6, strengthening from the 26.5k in the prior print, according to ADP. The headline number signals a monthly run rate of around 132k, which is consistent with subdued unemployment and healthy cyclical momentum.
With May’s 4.2% Consumer Price Index print poised to be the peak of annualized cost pressures in the US and slowdown anxiety resurfacing, Treasuries with minimum maturities of 10-years currently offer favorable risk-reward dynamics, in my opinion. With inflation retreating back to a 3-handle in June against the backdrop of tumbling fuel charges, slowing rent increases and decelerating housing valuations, duration can slip 30 basis points from here quickly. Additionally, fixed-income hedges equity portfolios that could experience some meaningful volatility if fears about substantial AI’s expenses and their uncertain return prospects worsen. Finally, an increasingly hawkish Kevin Warsh may even generate an inversion across the yield curve driven by a sharp climb in the shorter tenors, boding well for the long end of the complex, as bond vigilantes bet that the economy and market alike can’t withstand too many rate hikes. The debt compound is already in its flattest formation in 15 months.
Economic contraction in the eurozone continued this month but at a slightly slower rate than during May with the S&P Global Flash Eurozone PMI Composite climbing from 48.5 to 49.5, a three-month high but below the contraction-expansion threshold of 50. In June, manufacturing continued to be a burden with the Composite index’s gain resulting from the Flash Eurozone Services PMI Business Activity Index ascending to 48.9, another three-month high and up 2.2 points from May. Meanwhile, the Flash Eurozone Manufacturing PMI and its output counterpart fell from 51.6 and 51.3 to 51.3 and 51.2, which are four-month and five-month lows.
Companies continued to face challenges with securing new orders, which declined for the fourth consecutive month despite a marginal increase in requests for manufactured items. On a positive note, input inflation rose rapidly despite easing to its slowest pace in February. Output price pressures also slowed. In other areas, employment failed to register growth for the sixth consecutive month despite a marginal increase in the services industry. The gains were offset by cuts in manufacturing. Looking ahead, confidence ticked higher in both services and manufacturing but was still muted. Stronger sentiment in France helped counter a decline in Germany.
Japan’s business activity strengthened in June with the S&P Global Flash Japan Composite PMI Output Index climbing from 51.1 to 52.5. Gains were fairly broad among the flash indexes as follows:
Manufacturing and services businesses reported firm demand and growing backlogs of orders, prompting firms to expand their payrolls. Average selling prices, however, increased in response to higher input costs. At the same time, forecasts for the coming 12 months were muted by the Middle East crisis creating concerns about supply chain disruptions and inflation.
Prices in Singapore’s climbed 0.7% month over month (m/m) during May after falling 0.3% in April, according to the Consumer Price Index (CPI). The annualized metric along with its core counterpart, however, was unchanged with the two gauges climbing 1.8% and 1.4%. Economists anticipated y/y increases of 2% and 1.6% for the headline and core measurements. The m/m print was pushed up by the 2.4% spike in the housing and utilities category. Within this group, utilities and other fuels fell by 0.1% but the accommodation classification climbed by 2.7%. The health category followed with a 0.5% ascent with health insurance becoming 1.9% more costly than in the preceding month. The transport category and the food and beverage services segments, furthermore, climbed 0.3% and 0.2%. Conversely, prices for foods and beverages from stores sank 0.4% and the information and communications segment dropped 1.5%.
The Hong Kong CPI was up 2% y/y in May following the 1.7% April print. The m/m version, which was down 0.1% in April, was flat in May.
Contributors to the y/y increase and the extent of their price changes were as follows:
Durable goods, however, were 1.2% cheaper.
Information posted on IBKR Campus that is provided by third-parties does NOT constitute a recommendation that you should contract for the services of that third party. Third-party participants who contribute to IBKR Campus are independent of Interactive Brokers and Interactive Brokers does not make any representations or warranties concerning the services offered, their past or future performance, or the accuracy of the information provided by the third party. Past performance is no guarantee of future results.
This material is from IBKR Macroeconomics, an affiliate of Interactive Brokers LLC, and is being posted with its permission. The views expressed in this material are solely those of the author and/or IBKR Macroeconomics and Interactive Brokers is not endorsing or recommending any investment or trading discussed in the material. This material is not and should not be construed as an offer to buy or sell any security. It should not be construed as research or investment advice or a recommendation to buy, sell or hold any security or commodity. This material does not and is not intended to take into account the particular financial conditions, investment objectives or requirements of individual customers. Before acting on this material, you should consider whether it is suitable for your particular circumstances and, as necessary, seek professional advice.
Futures, event contracts, and forecast contracts are not suitable for all investors. Before trading these products, please read the CFTC Risk Disclosure. For a copy, visit our Warnings and Disclosures Page.
Trading in digital assets, including cryptocurrencies, is especially risky and is only for individuals with a high risk tolerance and the financial ability to sustain losses. Eligibility to trade in digital asset products may vary based on jurisdiction.
There is a substantial risk of loss in foreign exchange trading. The settlement date of foreign exchange trades can vary due to time zone differences and bank holidays. When trading across foreign exchange markets, this may necessitate borrowing funds to settle foreign exchange trades. The interest rate on borrowed funds must be considered when computing the cost of trades across multiple markets.
Spot currencies are not available at IBKR Singapore.
Municipal Bonds are only available from Interactive Brokers for IBKR LLC, IBKR Canada, IBKR Hong Kong, IBKR Australia and IBKR Singapore entities.
Related Articles


?")


Join The Conversation
For specific platform feedback and suggestions, please submit it directly to our team using these instructions.
If you have an account-specific question or concern, please reach out to Client Services.
We encourage you to look through our FAQs before posting. Your question may already be covered!