
- Solve real problems with our hands-on interface
- Progress from basic puts and calls to advanced strategies
Interactive Options Course

Posted April 6, 2026 at 10:15 am
March was a difficult month across traditional markets. Bitcoin, by contrast, stood out as one of the clearest relative outperformers. Against the backdrop of the US–Israeli operation against Iran, rising oil prices, and renewed inflation fears, Bitcoin gained 7% on the month while the S&P 500 declined roughly 4%, the 10-year bond (US10Y) grew by almost 11%, gold dropped 11.5%, and silver lost 5%.
This marked a notable shift in behaviour, but it was driven more by timing than any fundamental change in Bitcoin itself. March was unusual as gold and Treasuries, the usual safe havens, sold off alongside equities. Bitcoin typically falls sharply in these environments as well, but this time, most of the selling had already played out. After five consecutive negative months, excess positioning had largely been cleared, and forced sellers were exhausted. Thus, Bitcoin held up not because it suddenly became a hedge, but because there was simply less left to sell, aided by early signs of marginal buyers stepping back in.
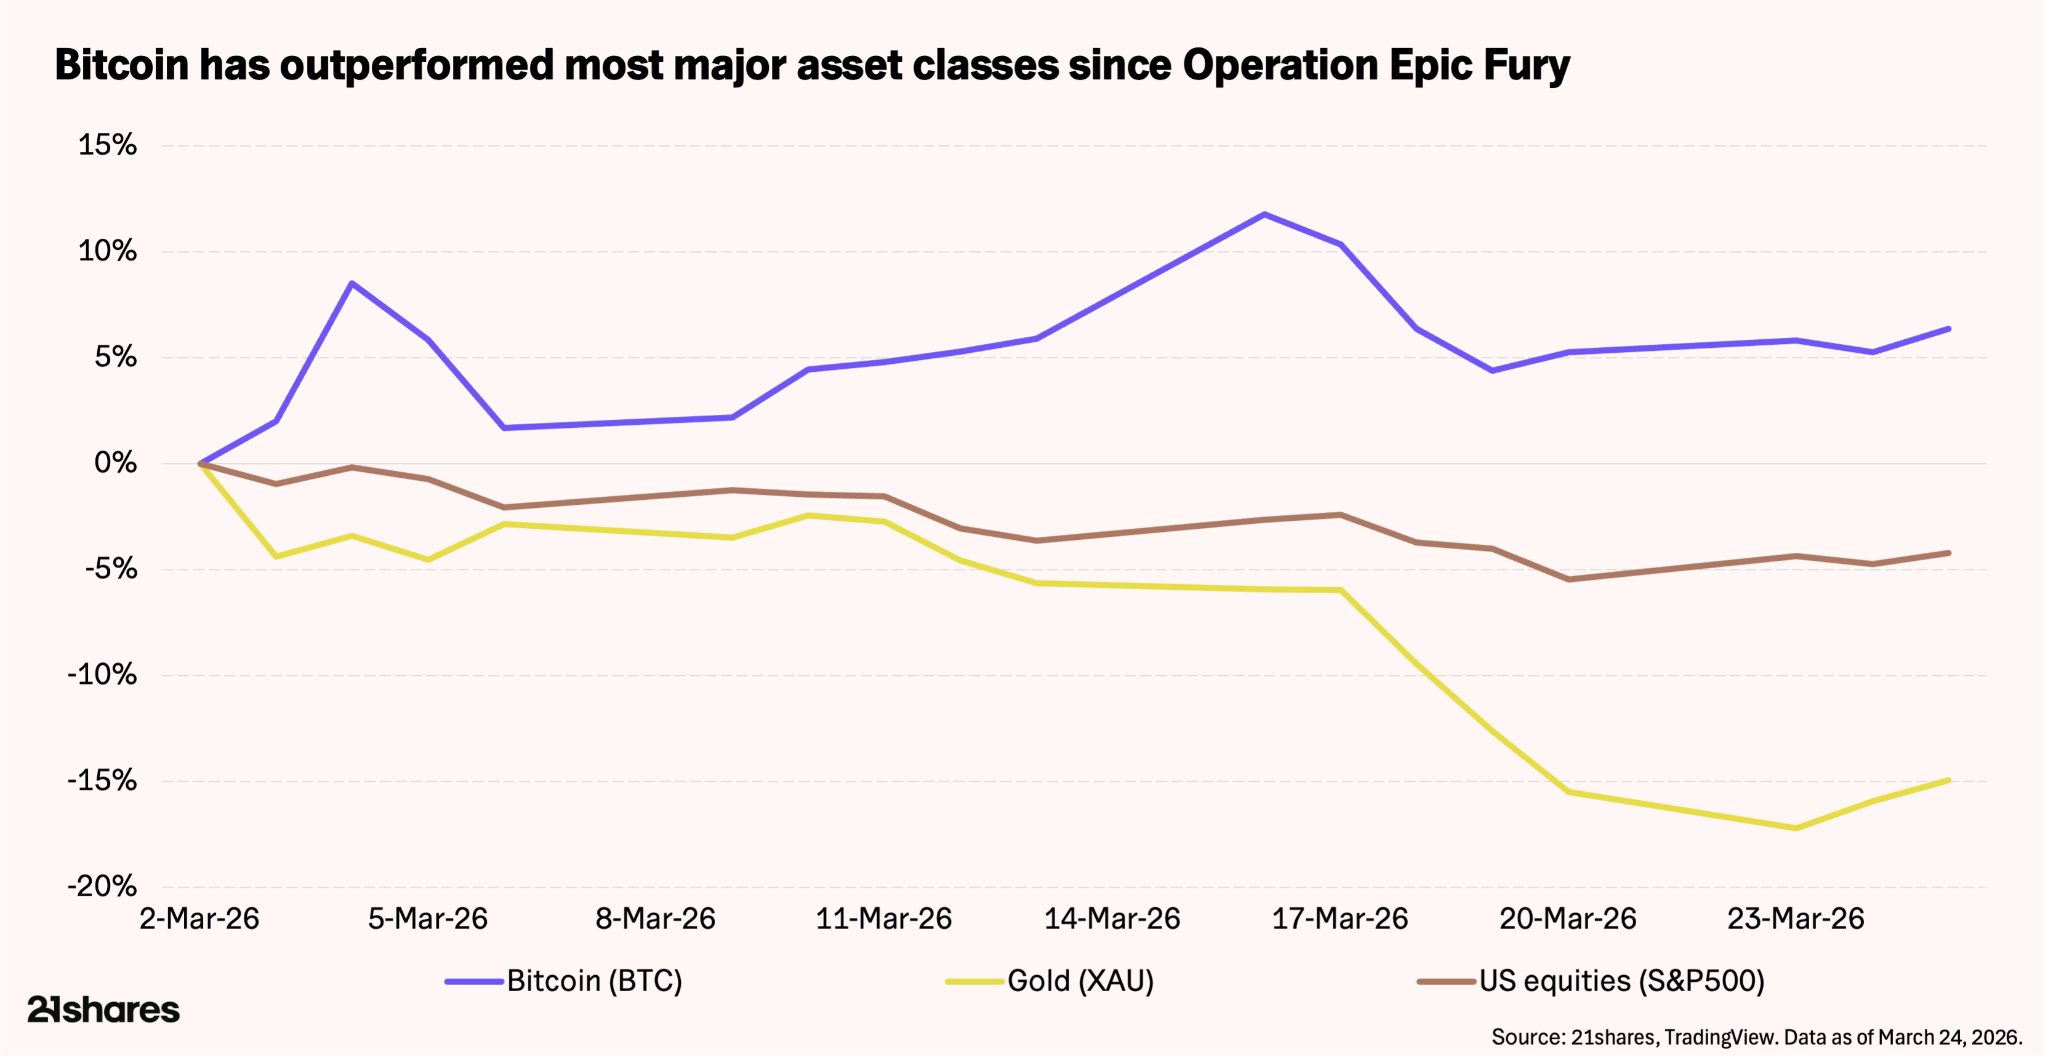
March’s price action was primarily driven by Operation Epic Fury. The US–Israeli escalation in the Strait of Hormuz – a chokepoint for 20% of global oil – sent Brent crude above $100/bbl, reigniting inflation fears. Consequently, global yields spiked as the US 20Y treasury breached 5% for the first time since April 2025, solidifying a “higher-for-longer” interest rate regime. Furthermore, interest rate hikes returned to the conversation globally.
Bitcoin responded by surging from $66,000 to a local peak of $76,000 before consolidating above the support floor we pointed to last month.
On the macro side, data remained largely mixed. While US CPI hit 2.4% YoY, US PPI arrived hotter than expected. Although the US Fed held rates steady on March 17–18, the higher-for-longer narrative has become more entrenched, with CME FedWatch pushing back the first expected cut, reflecting growing acceptance that rates will stay higher for longer than previously hoped.
On the regulatory front, March 17 also delivered a landmark moment: the SEC and CFTC jointly classified 16 major crypto assets as digital commodities rather than securities – a development we explore in more detail in the following section.
On March 17, the SEC and CFTC jointly classified 16 major cryptoassets – including Bitcoin, Ethereum, XRP, Solana, and more – as digital commodities under CFTC jurisdiction. This release supersedes the Gensler-era enforcement framework, removing a multi-year regulatory overhang that previously suppressed institutional participation.
While the CLARITY Act is still required to make these classifications permanent (without it, a future SEC chair could reverse the March 17 interpretation), its path through the Senate has been uneven. Senators Tillis and Alsobrooks reached an agreement in principle on stablecoin yield on March 20, but the draft language proved more restrictive than expected. Coinbase rejected the latest text this week, the second time it has pulled support. Other sticking points remain, including oversight of DeFi and ethics provisions. For investors, the key variable is timing. If the bill does not reach the Senate floor by May, it risks being shelved until after the midterms. That said, political tailwinds remain strong: Trump has framed the Act as a strategic priority, the SEC and CFTC have already signed the memorandum of understanding the Act would require, and prediction market odds for 2026 passage sit at roughly 62%1.
The energy supply disruption from the Strait of Hormuz closure has materially added to the upward pressure on an already stubborn inflation outlook. Current Polymarket odds price only a ~37%2 chance of Hormuz traffic returning to normal by end of April, and while a US-Iran ceasefire by June 30 sits at 65%, near-term resolution odds remain much lower – suggesting markets are not expecting a rapid resolution.
Ordinarily, that backdrop should be a headwind. Higher oil prices, firmer inflation expectations, and tighter financial conditions would typically weigh on liquidity-sensitive assets. Yet March’s price action suggests more nuanced behavior. That interpretation was strengthened by reports of surging self-custody flows off Iranian exchanges following the strikes, underscoring Bitcoin’s utility as a portable, censorship-resistant asset during periods of capital-flight necessity, echoing similar behavior observed during the Russia–Ukraine conflict in 2022 and the US regional banking crisis in 2023.
Looking further ahead, history suggests that if the conflict drags on, the response may ultimately shift toward hard assets. Every major US military engagement in the Middle East has eventually coincided with direct spending, deficit expansion, or monetary accommodation. If this situation persists without resolution, the pressure to provide more accommodative policy is likely to rise, even in the face of elevated inflation risk. In that environment, Bitcoin’s hedge thesis is likely to strengthen, rather than fade.
Trading slightly above $69,000, bitcoin remains below its 200-day moving average (DMA) at $91,000 – the 200 DMA will prove to be a resistance point bitcoin must overcome in the long run. However, the immediate focus is the 50 DMA ($68,879).
Historically, retaking this level serves as support for multi-month uptrends, which eventually lead to overtaking the 200 DMA. This has occurred as recently as February 2024, October 2024, and April 2025, with each instance acting as a launchpad for new all-time highs. For a shift in momentum, Bitcoin must treat the 50-day MA as a firm floor, providing the foundation needed to eventually challenge the overhead 200-day MA resistance.
With Bitcoin trading around $69,000, price action has solidified a structural framework anchored by prior cycle highs and high-volume consolidation zones, notably flipping the $68,000–$70,000 supply zone into a foundational support floor.
For long-term capital allocators, these levels matter the most:
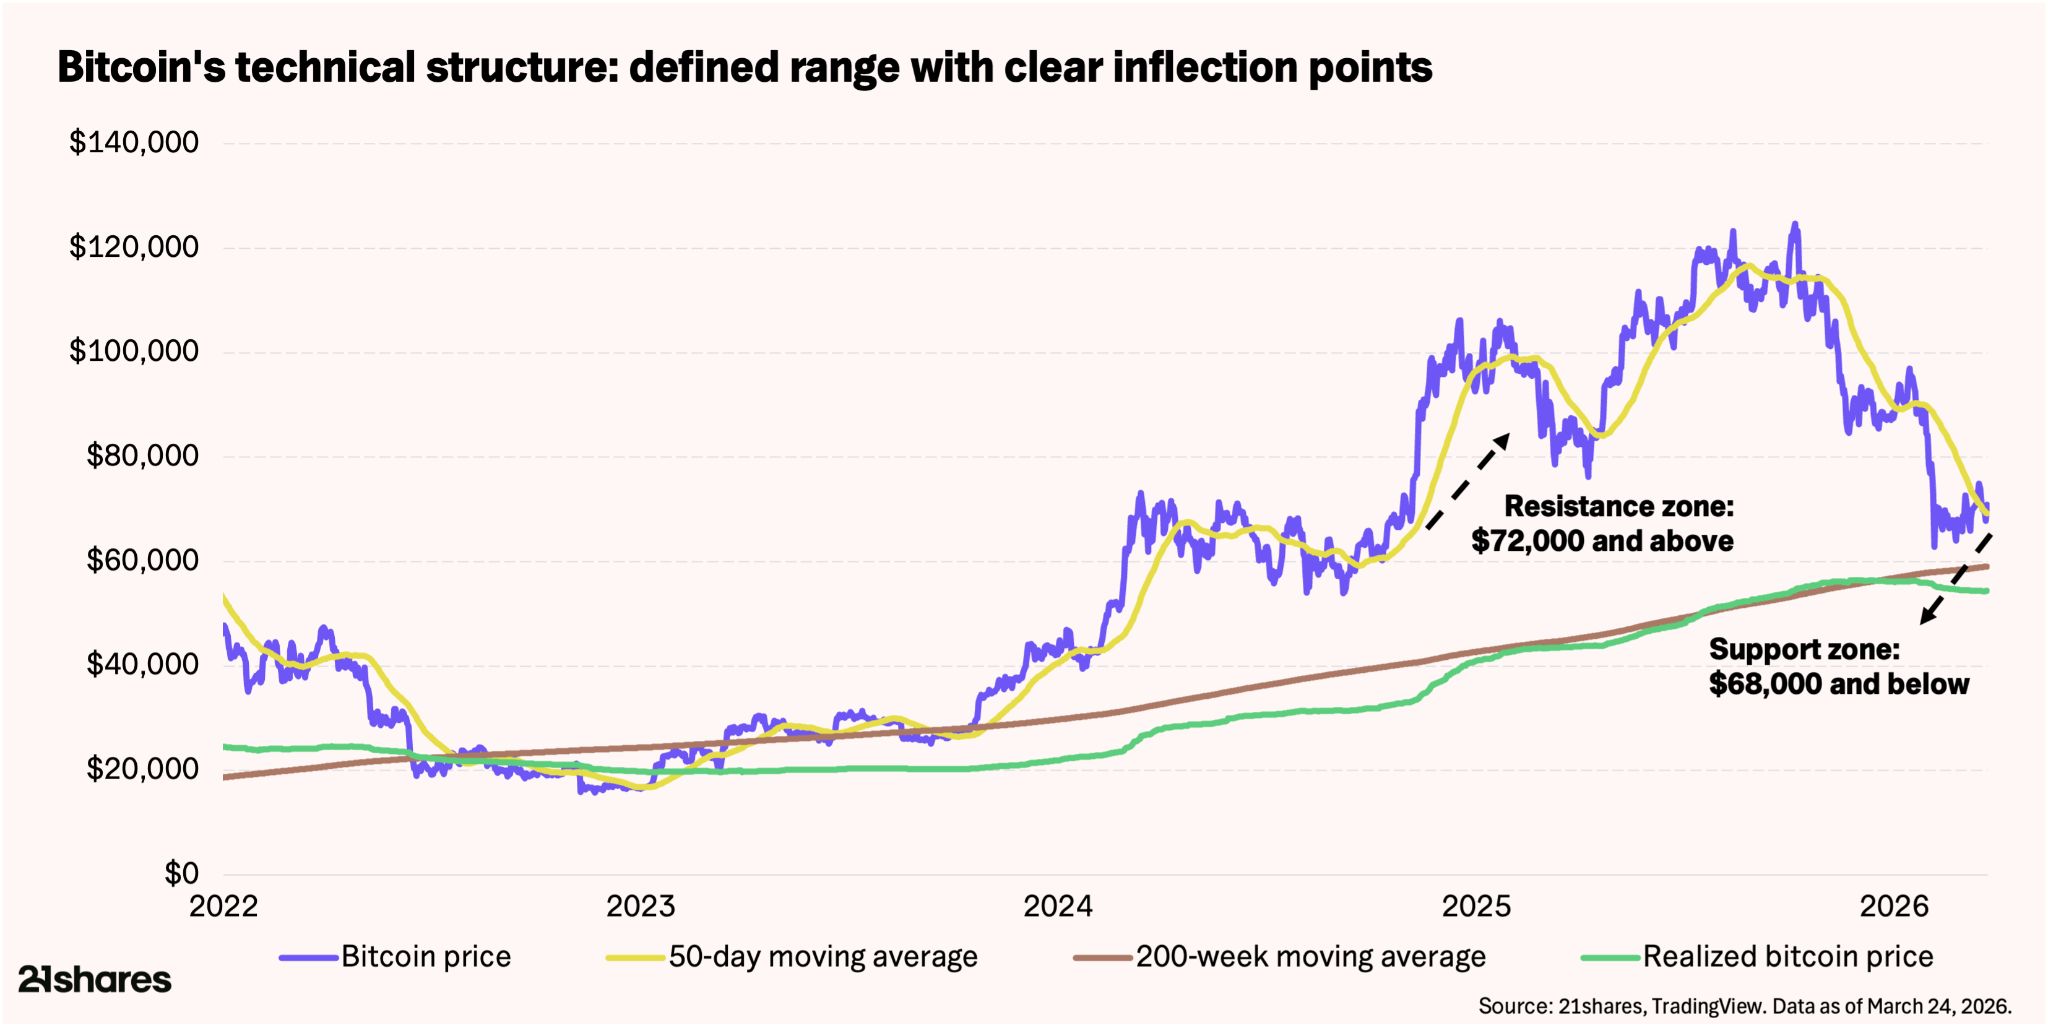
Bitcoin still continues to trade near its aggregated investor cost basis and the 200-week moving average, a region where Bitcoin has historically traded less than 5% of the time.
With leverage reduced, derivatives markets cleaner, and long-term holders intact, current levels remain a historically attractive accumulation zone.
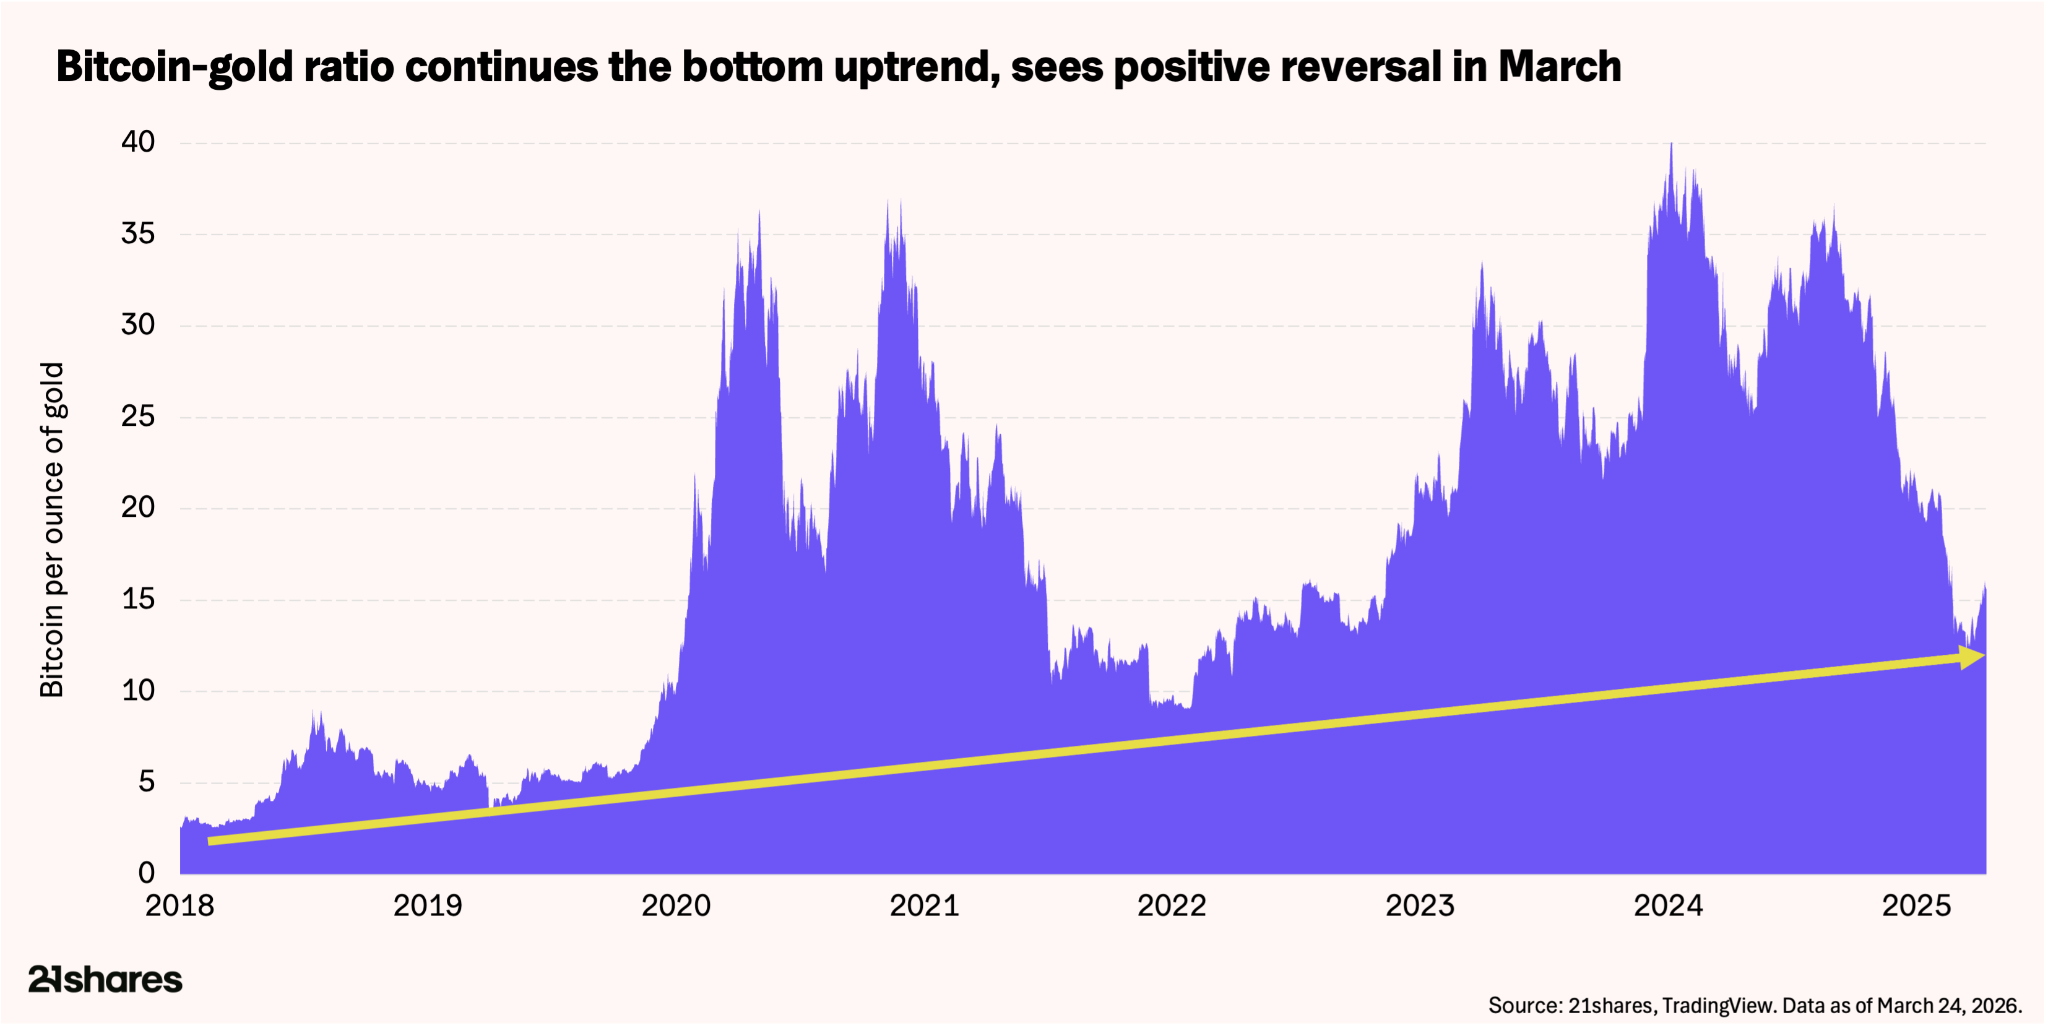
March combined two narratives we had been tracking separately into one: Bitcoin’s favorable reaction to Operation Epic Fury, and a violent structural pivot in the BTC:Gold ratio.
On the reaction front, Bitcoin’s 7% March rally defied precedent, outperforming the S&P 500 (-4%) and gold (-17%) during Operation Epic Fury. This decoupling stems from seller exhaustion, renewed ETF inflows, and Bitcoin’s utility as a borderless, censorship-resistant hedge. While Trump hints at de-escalation, Polymarket prices a June ceasefire at 59% and April Hormuz normalization at 27%; any formal resolution remains a major catalyst for the next leg higher.
On the ratio front, the BTC:Gold ratio found a structural floor at ~12.4x following the onset of Operation Epic Fury before recovering 30% to reach 16x by late March, reversing a 13-month decline. That decline has historically coincided with major Bitcoin market bottoms, suggesting positioning may already be largely reset. Further, the subsequent recovery should not be read purely as Bitcoin displacing gold as a traditional safe haven. Rather, it reflects a growing recognition of Bitcoin’s role as a permissionless, borderless rail for moving capital – especially when conflict disrupts traditional financial channels
As geopolitical risk persists, this distinction between storing value and moving it becomes more relevant. For allocators, that functional utility may ultimately matter more than whether Bitcoin fits the conventional safe-haven label.
March signaled a definitive reversal for US spot Bitcoin ETFs, which recorded ~$1.6 billion in net inflows, effectively reversing the consecutive outflows seen in January and February. Total assets reached $90 billion – absorbing 6% of Bitcoin’s market cap – with YTD outflows narrowing to just $210 million. This stabilization suggests a renewed institutional appetite as regulated capital seeks long-term exposure amidst ongoing geopolitical decoupling.
Complementing sticky ETF capital is DAT capital. Strategy’s recently announced over $44 billion ATM program creates a structural demand floor, absorbing sell pressure through programmatic buying. After growing its holdings by 50% (+263,000 BTC) last year, Strategy now holds 762,099 BTC ($54 billion) – serving as a primary stabilizer and long-term valuation anchor for the entire asset class.
Hyperliquid has pivoted from a crypto-native venue into a diversified exchange. Driven by geopolitical shocks in 2026, non-crypto assets now comprise 30% of total volume – an 800% increase since late 2025. With oil perpetuals hitting $8 billion in weekly volume and total Hyperliquid monthly volumes exceeding $200 billion, Bloomberg now cites Hyperliquid’s order books for weekend commodity pricing.
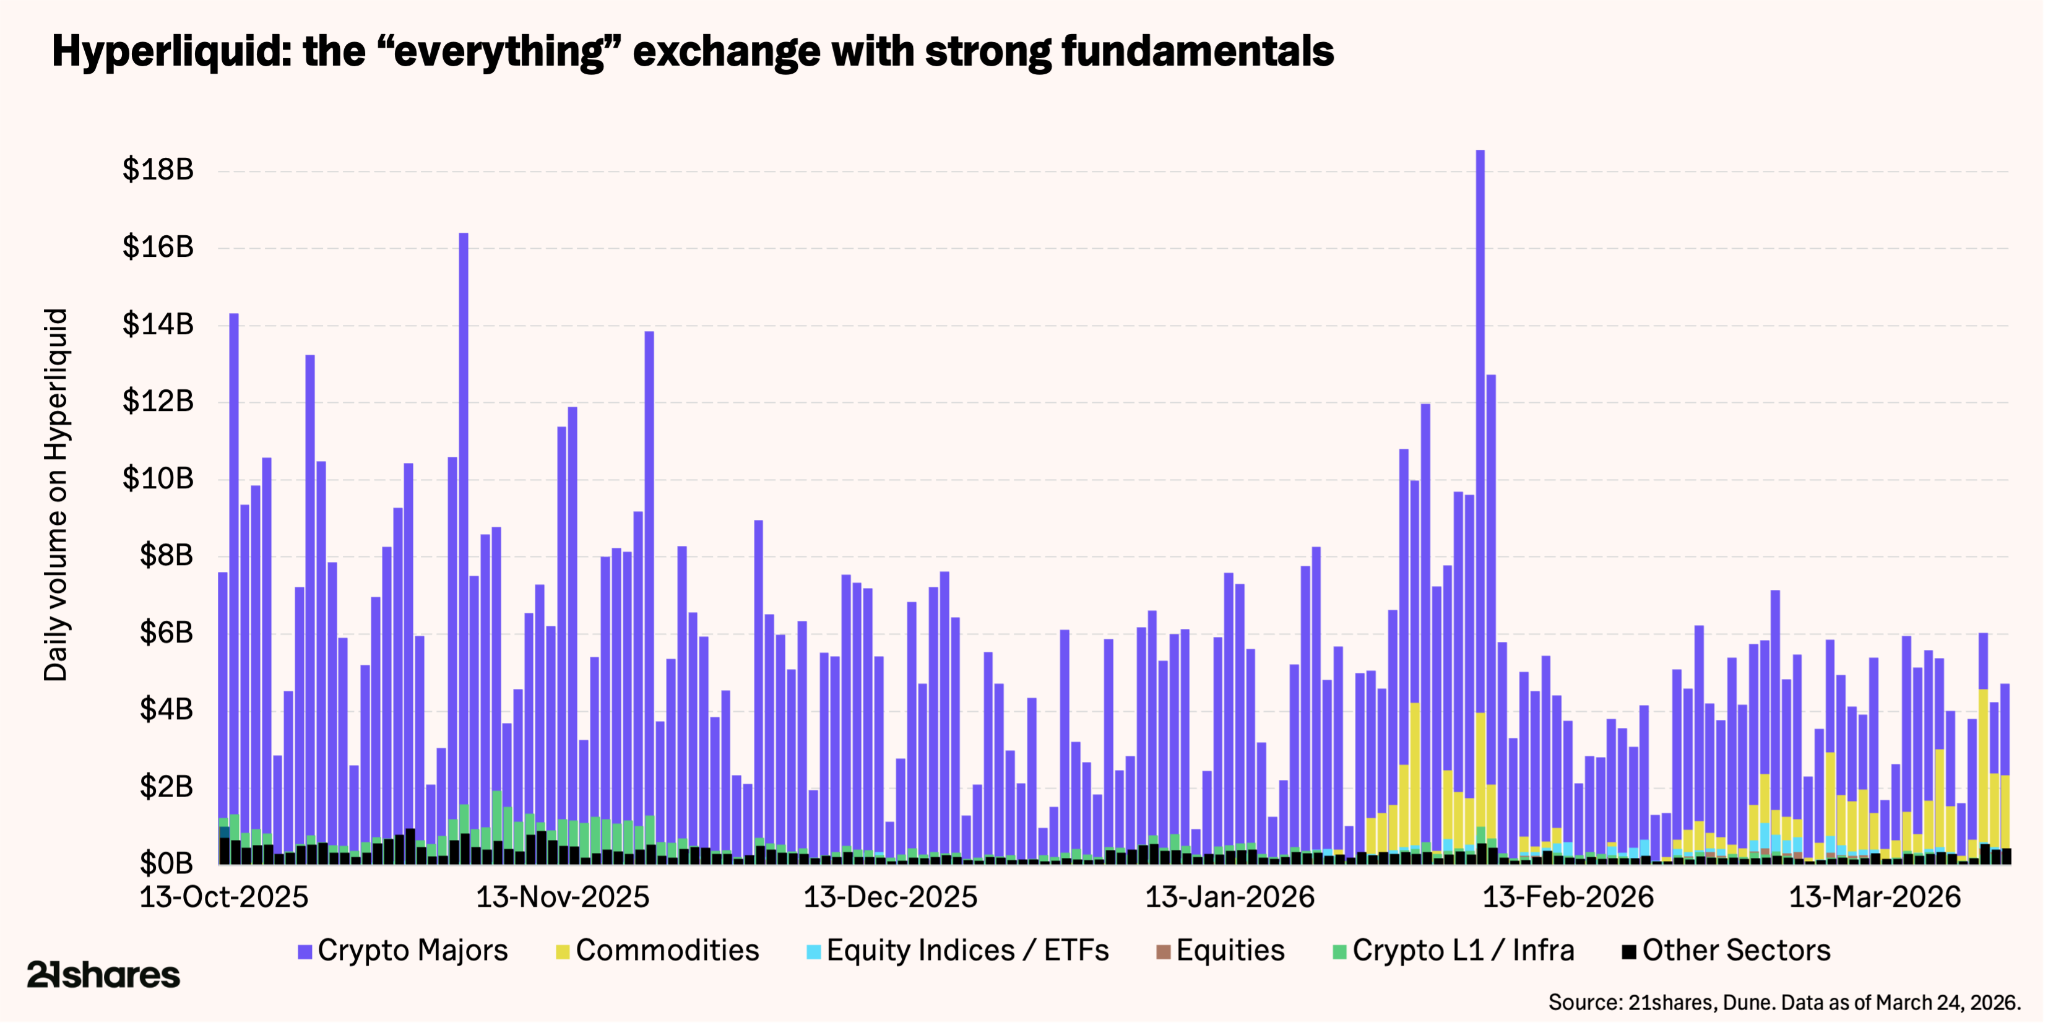
Hyperliquid’s 24/7/365 crypto-rails price geopolitical shocks days ahead of traditional markets, serving as a primary volatility index while traditional exchanges are closed. The protocol’s efficiency is staggering:
Traditional Finance validation is also accelerating. S&P Dow Jones Indices licensed3 the S&P 500 to Trade[XYZ] to launch the first officially approved perpetual contract on Hyperliquid, giving eligible non-US investors 24/7 leveraged exposure to the world’s most tracked equity benchmark on a decentralized platform. That a company behind trillions in index-linked products actively chose to license its flagship benchmark to onchain infrastructure speaks volumes about where institutional confidence is heading.
HYPE is up 50% YTD, with a low 30% correlation to the broader crypto market, and the upcoming HIP-4 upgrade will introduce options and prediction markets. Applying a CME-like 16–17x revenue multiple implies a bull-case valuation of $19 billion-$24 billion ($80–$100 per HYPE)
For a deeper dive, read our full Hyperliquid research report here.
March aligned unique catalysts: geopolitical risk acting as a catalyst for Bitcoin, SEC/CFTC regulatory clarity, and a surge in institutional capital. With the five-month losing streak snapped, market health is the cleanest in months – leverage has reset by 25%.
While technicals sit at a crossroads, ETF flows are decisively positive. Future momentum hinges on the Strait of Hormuz, the Fed’s inflation response, and the CLARITY Act’s legislative pace. A breakout foundation is building, but $76,000 remains the critical signal.
—
Originally Posted March 30, 2026 – How Bitcoin decoupled from broader reaction to uncertainty
Footnotes:
Information posted on IBKR Campus that is provided by third-parties does NOT constitute a recommendation that you should contract for the services of that third party. Third-party participants who contribute to IBKR Campus are independent of Interactive Brokers and Interactive Brokers does not make any representations or warranties concerning the services offered, their past or future performance, or the accuracy of the information provided by the third party. Past performance is no guarantee of future results.
This material is from 21Shares and is being posted with its permission. The views expressed in this material are solely those of the author and/or 21Shares and Interactive Brokers is not endorsing or recommending any investment or trading discussed in the material. This material is not and should not be construed as an offer to buy or sell any security. It should not be construed as research or investment advice or a recommendation to buy, sell or hold any security or commodity. This material does not and is not intended to take into account the particular financial conditions, investment objectives or requirements of individual customers. Before acting on this material, you should consider whether it is suitable for your particular circumstances and, as necessary, seek professional advice.
Trading in digital assets, including cryptocurrencies, is especially risky and is only for individuals with a high risk tolerance and the financial ability to sustain losses. Eligibility to trade in digital asset products may vary based on jurisdiction.
Investments in certain commodities (precious metals) may be subject to significant price volatility and often involve risks related to market fluctuations, liquidity constraints, geopolitical events, and changes in global economic conditions that could adversely affect their value.
U.S. Spot Gold trading through IB LLC accounts is only available to legal residents of the United States that do not reside in Arizona, Montana, New Hampshire, and Rhode Island.
Trading on margin is only for experienced investors with high risk tolerance. You may lose more than your initial investment. For additional information regarding margin loan rates, see ibkr.com/interest
Cryptocurrency based Exchange Traded Products (ETPs) are high risk and speculative. Cryptocurrency ETPs are not suitable for all investors. You may lose your entire investment. For more information please view the RISK DISCLOSURE REGARDING COMPLEX OR LEVERAGED EXCHANGE TRADED PRODUCTS.
Any discussion or mention of an ETF is not to be construed as recommendation, promotion or solicitation. All investors should review and consider associated investment risks, charges and expenses of the investment company or fund prior to investing. Before acting on this material, you should consider whether it is suitable for your particular circumstances and, as necessary, seek professional advice.
Futures are not suitable for all investors. The amount you may lose may be greater than your initial investment. Before trading futures, please read the CFTC Risk Disclosure. A copy and additional information are available at ibkr.com.
Related Articles


Join The Conversation
For specific platform feedback and suggestions, please submit it directly to our team using these instructions.
If you have an account-specific question or concern, please reach out to Client Services.
We encourage you to look through our FAQs before posting. Your question may already be covered!