
- Solve real problems with our hands-on interface
- Progress from basic puts and calls to advanced strategies
Interactive Options Course

Posted February 19, 2026 at 10:34 am
By Alex Cole
1/ Volume
2/ Volatility Squeezes
3/ GoNoGo Volume and Volatility
Investopedia is partnering with CMT Association on this newsletter. The contents of this newsletter are for informational and educational purposes only, however, and do not constitute investing advice. The guest authors, which may sell research to investors, and may trade or hold positions in securities mentioned herein do not represent the views of CMT Association or Investopedia. Please consult a financial advisor for investment recommendations and services.
Volume
Volume is most likely the first non price derivative indicator that a technician will look at. A sensible way to think of volume as it relates to securities trading is as market participation. If there is a lot of volume, market participants are getting involved. It is therefore easy to see why volume is used as a confirmatory indicator. If the price is moving higher, an analyst will look for supportive volume.
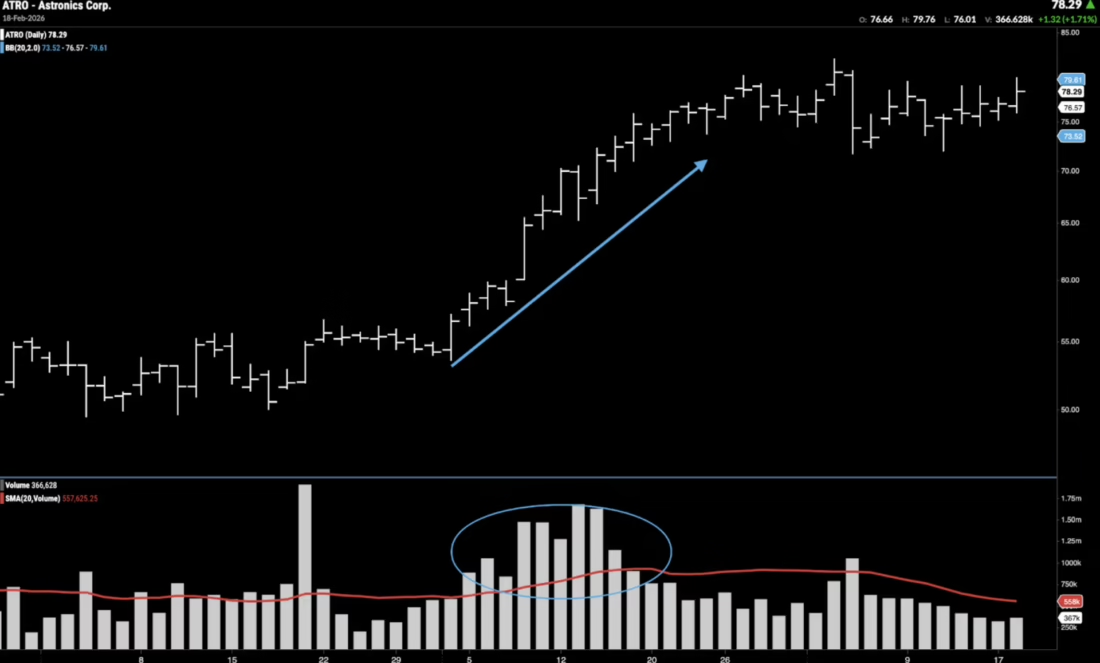
In the first chart, we have a volume histogram with a simple moving average overlay applied to the price history of ATRO. Look at the section of the chart where price moves higher (blue arrow). In the volume panel below, we can see that volume was significantly higher than its moving average during that time. The market is participating in the price move. This tends to support higher prices. After the rise, as price moves mostly sideways, we see that volume falls back below the average.
Volatility Squeezes
Another important concept when looking at financial charts is that of the volatility squeeze. Imagine squeezing a tube of toothpaste with the top still on (this is how it was explained to me several decades ago!), eventually the top will blow off. If price movements are compressed over time, often a vigorous move will ensue. Periods of low volatility can be followed by periods of high volatility. As technicians, we try to find those situations as they can become the beginnings of trends.
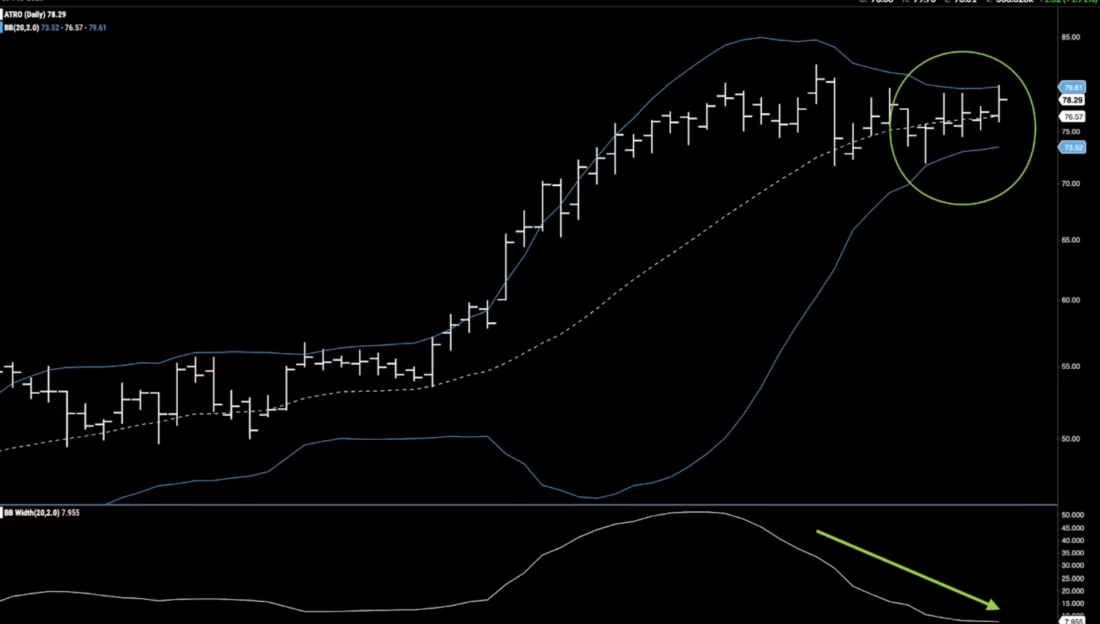
The second chart shows the price of ATRO with the Bollinger Bands indicator applied. We briefly introduced the Bollinger Bands at the beginning of this series. We talked about price trading outside of the bands as an important measure of thrust. Another way to read the bands is to look for situations where the bands narrow. A Bollinger Band squeeze sets the analyst up for a potential move. Look at the right side of the chart. We see a narrowing of the bands. In the lower panel, an indicator displays the band width. We can see how volatility has been shrinking.
GoNoGo Volume and Volatility
Central to our goal of simplification, the GoNoGo Oscillator includes volume and volatility analysis in one panel. A comparison of current volume to a historical moving average is made in the background and if the volume is higher than its simple moving average, the GoNoGo Oscillator changes from aqua to a dark blue. Look at the area of the chart where price moves higher and note the dark blue color of GoNoGo Oscillator. This informs the technician that market participation is confirming the move we see in the price panel.
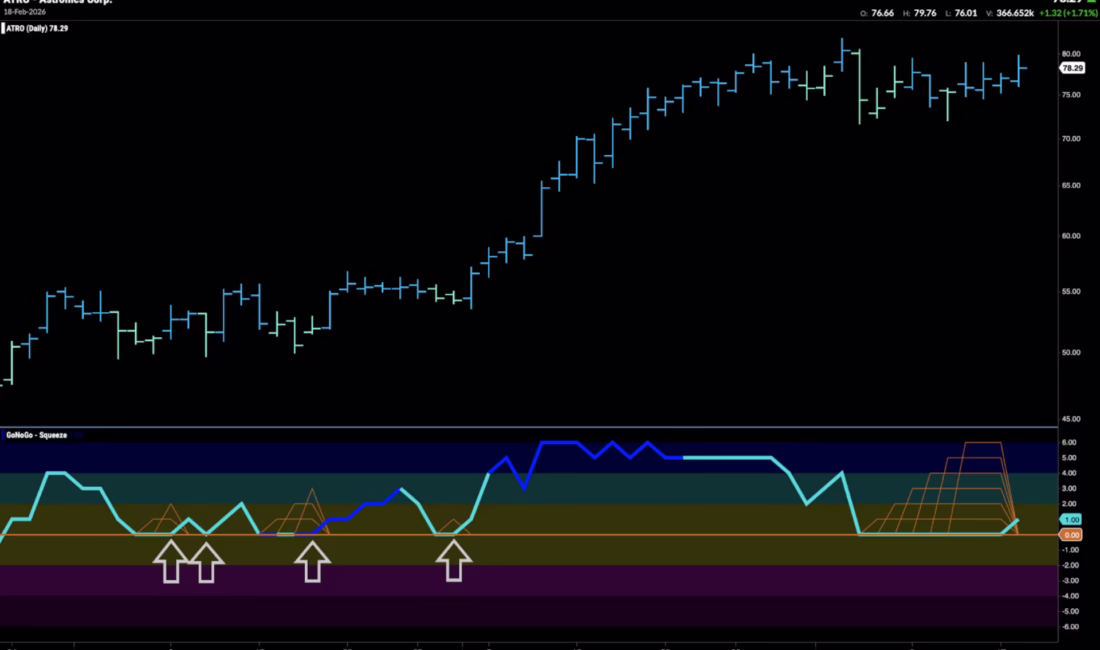
We know that when a trend is in place, all of the inputs for momentum analysis should confirm. For example, in an up trend, it would not make sense to get oversold readings. The GoNoGo Oscillator is calculated in such a way that when the momentum inputs fall out of an extreme and are all in neutral territory, the indicator falls to zero. In that way, we can use the zero line as an objective level for trend support. See the grey arrows on the chart. Given the importance of the zero line, we also know that when the indicator gets stuck at that level, there is very little directional momentum. In other words, it is a period of reduced volatility. The climbing grid of the GoNoGo Squeeze reflects the virtual tug of war between buyers and sellers. See the extended Max GoNoGo Squeeze (amber climbing grid) at current price levels. We have now seen how we can understand the full technical picture of trend, momentum, volume and volatility using one price, and one oscillator panel using the GoNoGo Chart.
—
Originally posted 19th February 2026
Investopedia.com: The comments, opinions and analyses expressed herein are for informational purposes only and should not be considered individual investment advice or recommendations to invest in any security or to adopt any investment strategy. While we believe the information provided herein is reliable, we do not warrant its accuracy or completeness. The views and strategies described on our content may not be suitable for all investors. Because market and economic conditions are subject to rapid change, all comments, opinions and analyses contained within our content are rendered as of the date of the posting and may change without notice. The material is not intended as a complete analysis of every material fact regarding any country, region, market, industry, investment or strategy. This information is intended for US residents only.
Information posted on IBKR Campus that is provided by third-parties does NOT constitute a recommendation that you should contract for the services of that third party. Third-party participants who contribute to IBKR Campus are independent of Interactive Brokers and Interactive Brokers does not make any representations or warranties concerning the services offered, their past or future performance, or the accuracy of the information provided by the third party. Past performance is no guarantee of future results.
This material is from Investopedia and is being posted with its permission. The views expressed in this material are solely those of the author and/or Investopedia and Interactive Brokers is not endorsing or recommending any investment or trading discussed in the material. This material is not and should not be construed as an offer to buy or sell any security. It should not be construed as research or investment advice or a recommendation to buy, sell or hold any security or commodity. This material does not and is not intended to take into account the particular financial conditions, investment objectives or requirements of individual customers. Before acting on this material, you should consider whether it is suitable for your particular circumstances and, as necessary, seek professional advice.
Related Articles

 for Daily Seasonal Data")


Join The Conversation
For specific platform feedback and suggestions, please submit it directly to our team using these instructions.
If you have an account-specific question or concern, please reach out to Client Services.
We encourage you to look through our FAQs before posting. Your question may already be covered!