
- Solve real problems with our hands-on interface
- Progress from basic puts and calls to advanced strategies
Interactive Options Course

Posted October 1, 2025 at 1:06 pm
A series of commitments this morning and early afternoon have made it impossible for me to write a normal length piece today. Instead, I’ll simply offer a couple of quick data points about seasonality – or the lack thereof – that I find interesting.
First, as has been widely reported, the S&P 500 (SPX) just finished its best September in 15 years. Last month’s 3.53% advance was above even last September’s 2.02% rise and fell short only to 2010’s 8.76% jump in recent history. We noted earlier this month that while September is statistically the worst month of the year, whether we go up or down in any given September is essentially a coin flip, even while considering the four year down streak that was broken last year.
There is indeed truth to the “September Scaries”, but data show that a decline in September is far from pre-ordained. Yes, September is statistically the worst month of the year for the S&P 500 (SPX). It is only one of four that show net declines over the past 25 years, but it is by far the worst. (According to Bloomberg data, January has averaged -0.19% this century; February -0.46%, June -0.25%, and September 1.51%). Yet over that period, the likelihood of a September decline is only slightly greater than that of a coin flip: 12 of the past 25 Septembers have seen positive returns for SPX.
Looking ahead, we see that October is a month that has averaged solidly positive returns of 1.31% over the prior 25 years, but we have a fair dispersion of results as well. The odds are a bit better for an up month, 10 of 25, but that is hardly a resounding consensus. When we narrow the data set to Octobers that follow positive Septembers, we see that five of them resulted in lower SPX returns for that month. If you’re looking for a definitive pattern, I’ve yet to find one.
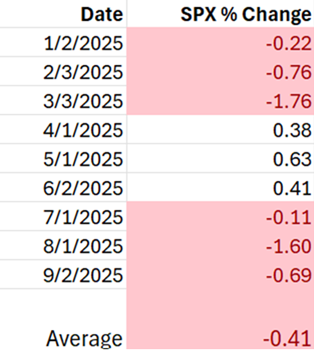
One pattern that is intriguing is the recent preponderance of down days to start the trading month. Of the nine months prior to this one, six have begun with SPX trading lower, for an average decline of 0.41%. To be fair, SPX was sharply lower this morning when I collected the data – it’s now modestly positive – but a decline would fit in this pattern. It’s probably spurious, though it could be a bit of a hangover from month- or quarter-end position markups. I know some of you doubt that it occurs, but I assure you from my experience dealing with institutional investors that it does occur. How else might we explain yesterday’s late elevator ride higher.
Source: Interactive Brokers
The analysis in this material is provided for information only and is not and should not be construed as an offer to sell or the solicitation of an offer to buy any security. To the extent that this material discusses general market activity, industry or sector trends or other broad-based economic or political conditions, it should not be construed as research or investment advice. To the extent that it includes references to specific securities, commodities, currencies, or other instruments, those references do not constitute a recommendation by IBKR to buy, sell or hold such investments. This material does not and is not intended to take into account the particular financial conditions, investment objectives or requirements of individual customers. Before acting on this material, you should consider whether it is suitable for your particular circumstances and, as necessary, seek professional advice.
The views and opinions expressed herein are those of the author and do not necessarily reflect the views of Interactive Brokers, its affiliates, or its employees.
Related Articles


Join The Conversation
For specific platform feedback and suggestions, please submit it directly to our team using these instructions.
If you have an account-specific question or concern, please reach out to Client Services.
We encourage you to look through our FAQs before posting. Your question may already be covered!